Subscribe to our ▶️ YouTube channel 🔴 for the latest videos, updates, and tips.
Distance between Two Points in Polar Co-ordinates
How to find the distance between two points in polar Co-ordinates?
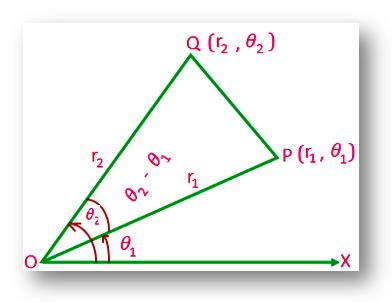
Let OX be the initial line through the pole O of the polar system and (r₁, θ ₁) and (r₂, θ₂) the polar co-ordinates of the points P and Q respectively. Then, OP₁ = r₁, OQ = r₂, ∠XOP = θ₁ and ∠XOQ = θ₂, Therefore, ∠POQ = θ₂ – θ₁.
From triangle POQ we get,
PQ² = OP² + OQ² – 2 ∙ OP ∙ OQ ∙ cos∠POQ
= r₁² + r₂² – 2r₁ r₂ cos(θ₂ - θ₁)
Therefore, PQ = √[r₁² + r₂ ² - 2r₁ r₂ cos(θ₂ - θ₁)].
Second Method: Let us choose origin and positive x-axis of the cartesian system as the pole and initial line respectively of the polar system. If (x₁, y₁) , (x₂, y₂) and (r₁, θ₁) (r₂, θ₂) be the respective Cartesian and polar co-ordinates of the points P and Q, then we shall have,
x₁ = y₁ cos θ₁, y₁ = r₁ sin θ₁
and
x₂ = r₂ cos θ₂, y₂ = r₂ sin θ₂.
Now, the distance between the points P and Q is
PQ = √[(x₂ - x₁)² + (y₂ - y₁)²]
= √[(r₂ cos θ₂ - r₁ cos θ₁)² + (r₂ sin θ₂ - r₂ sin θ₂)²]
= √[r₂² cos² θ₂ + r₁ ² cos² θ₁ - 2 r₁r₂ cos θ₁ cos θ₂ + r₂² sin² θ₂ + r₁²sin² θ₁ - 2 r₁r₁ sin θ₁ sin θ₂]
= √[r₂² + r₁² - 2r₁ r₂ Cos(θ₂ - θ₁)].
Example on distance between two points in polar Co-ordinates:
Find the length of the line-segment joining the points (4, 10°) and (2√3 ,40°).
Solution:
We know that the length of the line-segment joining the points (r₁, θ₁),and (r₂, θ₂), is
√[ r₂² + r₁² - 2r₁ r₂ Cos(θ₂ - θ₁)].
Therefore, the length of the line-segment joining the given points
= √{(4² + (2√3)² - 2 ∙ 4 ∙ 2√(3) Cos(40 ° - 10°)}
= √(16 + 12 - 16√3 ∙ √3/2)
= √(28 - 24)
= √4
= 2 units.
● Co-ordinate Geometry
- What is Co-ordinate Geometry?
- Rectangular Cartesian Co-ordinates
- Polar Co-ordinates
- Relation between Cartesian and Polar Co-Ordinates
- Distance between Two given Points
- Distance between Two Points in Polar Co-ordinates
- Division of Line Segment: Internal & External
- Area of the Triangle Formed by Three co-ordinate Points
- Condition of Collinearity of Three Points
- Medians of a Triangle are Concurrent
- Apollonius' Theorem
- Quadrilateral form a Parallelogram
- Problems on Distance Between Two Points
- Area of a Triangle Given 3 Points
- Worksheet on Quadrants
- Worksheet on Rectangular – Polar Conversion
- Worksheet on Line-Segment Joining the Points
- Worksheet on Distance Between Two Points
- Worksheet on Distance Between the Polar Co-ordinates
- Worksheet on Finding Mid-Point
- Worksheet on Division of Line-Segment
- Worksheet on Centroid of a Triangle
- Worksheet on Area of Co-ordinate Triangle
- Worksheet on Collinear Triangle
- Worksheet on Area of Polygon
- Worksheet on Cartesian Triangle
11 and 12 Grade Math
From Distance between Two Points in Polar Co-ordinates to HOME PAGE
Didn't find what you were looking for? Or want to know more information about Math Only Math. Use this Google Search to find what you need.


New! Comments
Have your say about what you just read! Leave me a comment in the box below. Ask a Question or Answer a Question.