Subscribe to our ▶️ YouTube channel 🔴 for the latest videos, updates, and tips.
Frequency Distribution
In 7ᵗʰ grade and 8ᵗʰ grade frequency distribution, we will cover presentation of data, frequency and also about frequency distribution using the examples.
Presentation of Data: After collecting the data, it is condensed in the tabular form in order to study its features, Such an arrangement is called presentation of data.
Observation: Each entry collected as a numerical fact in the given data is called the observation.
Frequency: It is quite possible that in many situations two or more observations are identical, thus, the number of times a particular observation occurs is known as frequency.
For Example:
(i) If 4 students get 68 marks, then we say that the frequency of 68 is 4.
If this is done for all the observations and the data is rearranged from the lowest to the highest value; frequency distribution is obtained.
(ii) If 3 girls have height 156cm, then we say that frequency of 156 cm is 3.
Frequency Distribution Table:
The table in which such a distribution of frequencies is given is called the frequency distribution table.
For Example:
Frequency distribution of marks obtained by 15 students of class VIII-A in mathematics is given.
| Marks Obtained | Frequency |
| 29 | 1 |
| 31 | 3 |
| 34 | 2 |
| 37 | 6 |
| 46 | 1 |
| 48 | 1 |
| 49 | 1 |
| Total | 15 |
Note: The number of times a particular observation occurs in a given data is called its frequency of an observation:.
What is frequency distribution?
The tabular arrangement of data showing the frequency of each observation using tally marks or by condensing the data into classes or groups is called frequency distribution.
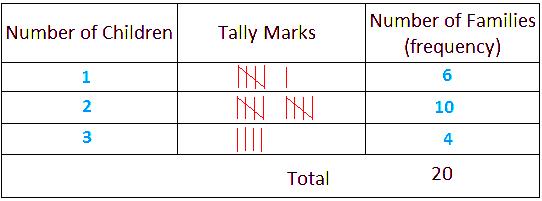
1. Suppose we make a survey of 20 families of a locality and find out the number of children in each family.
Let the observations be
2, 2, 3, 1, 1, 2, 3, 2, 2, 1, 2, 2, 3, 1, 2, 1, 1, 3, 2, 2.
State the frequency of each observation.
Solution:
Arranging the data in ascending order, we get the observations as
1, 1, 1, 1, 1, 1, 2, 2, 2, 2, 2, 2, 2, 2, 2, 2, 3, 3, 3, 3.
We find that
1 occurs 6 times;
2 occurs 10 times;
and 3 occurs 4 times.
We say that the frequency of families having 1 child is 6,
the frequency of families having 2 children is 10,
and the frequency of families having 3 children is 4.
We may represent the above data in a tabular form, showing the frequency of each observation.
This tabular form of representation is called frequency distribution.
For counting, we use tally marks |||| and the fifth tally mark is entered as
by crossing diagonally the four tally marks already entered.
Thus, the frequency distribution table of the above data may be presented as given below.
Frequency Distribution Table
Frequency Table
We can represent data in tabular form too. Such tables are called frequency tables. Frequency means how frequently a particular item is repeated in data.
Let us understand this with the help of an example.
1. Nairitee bought 12 bananas, 7 apples, 9 oranges, 6 mangoes and 5 coconuts. Represent the data by frequency table.
Solution:
Here, we represent the data, the numbers of different fruits, by tally marks (vertical bars). We use 1 bar for 1 fruit. Remember, after 4 vertical bars, we represent fifth fruit by crossing the four bars. The total number of bars represents the total number of fruits.
The table represents different fruits purchased by Nairitee.
● Data Handling
● Data Handling - Worksheet
From Frequency Distribution to HOME PAGE
Didn't find what you were looking for? Or want to know more information about Math Only Math. Use this Google Search to find what you need.


New! Comments
Have your say about what you just read! Leave me a comment in the box below. Ask a Question or Answer a Question.