Subscribe to our ▶️ YouTube channel 🔴 for the latest videos, updates, and tips.
Data Handling
In data handling we will learn how to do data analysis or data processing while handling data in mathematics.
What is data handling in math?
In various fields, we need information in the form of numerical figures.
Each figure of this kind is called an observation.
The collection of all the observations is called data.
Some Important Terms Related to Data Handling:
Some important terms used in data handling are defined below.
Data: A collection of numerical facts regarding a particular type of information is called data.
Each numerical fact of this type is known as an observation.
Raw data: A collection of observations gathered initially is called raw data.
In other words,
The original form of data is called raw data.
Range: The difference between the highest and the lowest values of the observations in a data is called the range of the data.
Statistics: It is the science which deals with the collection, presentation, analysis and interpretation of numerical data.
Observation: Each numerical figure in a data is called an observation.
Array: Arranging the numerical figures in an ascending or a descending order is called an array.
Frequency of an Observation: The number of times a particular observation occurs is called its frequency.
Tabulation of Data: Arranging the data in a systematic form in the tabular format is called tabulation or presentation of the data.
What is Data?
The initial step of any investigation is the collection of data. If may be a collection of numbers, figures. facts, or symbols. Thus, collection of information in the form of numerical figures is called data.
There are two types of data:
(i) Primary Data and
(ii) Secondary Data.
(i) Primary Data:
The data collected directly from the source is called the primary data.
For example, the data collected by Prf. John is a primary data.
(ii) Secondary Data:
When the data is collected from an external source, it is called the secondary data.
The data collected from magazines, internet, etc, is secondary data.
Collecting and Arranging of Data:
In order to preserve data, we need to collect the data, organise them, and record them so that whenever we want to use the information, we can refer to it.
How to arrange the data in tabular form?
Organisation of data helps in bringing about meaningful conclusion from the data.
For example some students of Class VIII took part in a dancing competition. The judges gave the following grades: A. B. C. D. E etc.
Does it make any sense to you?
This is data but out meaningful. To make the data meaningful, we have to arrange the data in a tabular form.
|
Name of the Student |
Grade |
|
James |
A |
|
Mary |
B |
|
Michael |
A |
|
Patricia |
C |
|
Robert |
C |
|
Jennifer |
D |
|
John |
A |
|
Linda |
B |
Now, you can understand and analyse the data.
Let us take an example:
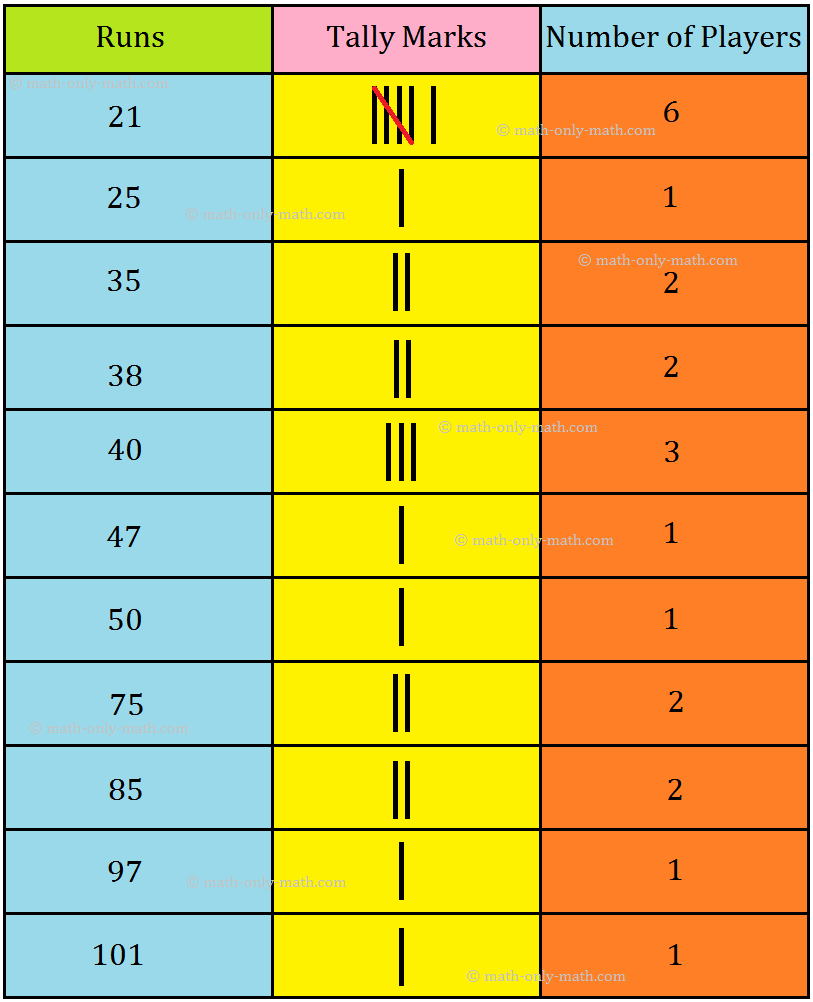
The sports teacher in a school wants to know the runs scored by the players of both the teams in the previous match. For this, he called each and every player and note down their runs as given below:
35, 21, 40, 25, 21, 47, 21, 35, 85, 38, 21,75, 21, 97, 40, 50, 101, 21, 38, 40, 75, 85
This way of recording the does not help him to answer the following questions easily:
(i) How many players made a half-century?
(ii) What is the maximum runs scored?
(iii) Difference between the maximum and minimum runs scored.
(iv) How many players scored 75 runs or more runs?
Now, he wrote the above data in ascending or descending order.
21, 21, 21, 21, 21, 21, 25, 35, 35, 38, 38, 40, 40, 40, 47, 50, 75, 75, 85, 85, 97, 101
This is a better way of writing the collected data but it is time-consuming and there is always a possibility of missing some numbers, if the information is collected for a larger number persons. It may be helpful in answering the questions given in (1) to (iii), but we might find difficult to answer question (iv).
When the number of observation is larger, to minimise the number of errors and to ma tabulation easier, we can use tally marks. In the tally marks method we draw three columree In the first column, write runs, in the second column, tally marks, and in the third colum the number of players. Tally marks are always recorded in bunches of five. Fifth tally mark drawn diagonally across the first four to make a group of five.
Finally, after counting tally marks, the actual numbers can be written in the third column which represent frequency. Now, looking at the table, we can easily answer the question (iv) too. The above form of representation of data is know as frequency distribution table.
Solved Examples on Data Handling:
1. Given below are the marks (out of 100) in mathematics obtained by 20 students of a class in an annual examination.
23 75 56 42 70 84 12 61 40 63
87 58 35 80 14 63 49 72 66 61
Arrange the above data in ascending order and find
(i) the lowest marks obtained,
(ii) the highest marks obtained,
(iii) the range of the given data.
Solution:
Arranging the above data in ascending order, we get:
14 23 35 40 42 49 51 56 58 61
63 63 66 70 72 75 80 84 87 92
From the above data analysis, we make the following observations.
(i) Lowest marks obtained = 14.
(ii) Highest marks obtained = 92.
(iii) Range of the given data = (92 - 14) = 78.
2. Given below are the heights (in cm) of 11 boys of a class:
146, 143, 148, 132, 128, 139, 140, 152, 154, 142, 149
Arrange the above data in ascending order and find
(i) the height of the tallest boy,
(ii) the height of the shortest boy,
(iii) the range of the given data.
Solution:
Arranging the given data in ascending order, we get the heights (in cm) as
128, 132, 139, 140, 142, 143, 146, 148, 149, 152, 154.
From the above data, we get the following results.
(i) The height of the tallest boy = 154 cm.
(ii) The height of the shortest boy = 128 cm.
(iii) Range of the given data = (154 - 128) cm = 26 cm.
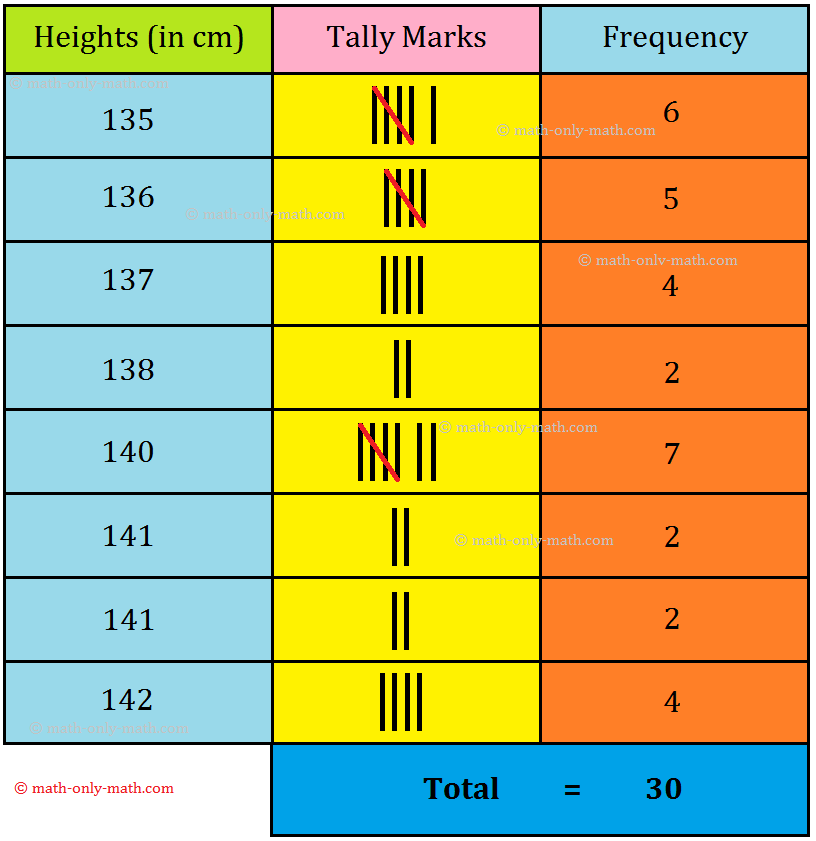
3. The heights (in cm) of 30 students of a class are as given below:
140, 137, 141, 135, 137, 140, 135, 137, 135, 135, 140, 140, 141,142, 138, 135, 136, 137, 135, 140, 136, 136, 142, 136, 140, 140, 142, 136, 138, 142.
Arrange the above data in ascending order, also in the form of a frequency distribution table. What is the range of the above data?
Solution:
Arranging the data in ascending order, we get
135, 135, 135, 135, 135, 135, 136, 136, 136, 136, 136, 137, 137, 137, 137, 138, 138, 140, 140, 140, 140, 140, 140, 140, 141, 141, 142, 142, 142, 142.
This is arrayed data.
We observe in the arrayed data that 6 students have the height 135 cm. So, frequency for height 135 cm is 6.
Similarly, 5 students have height 136 cm. So, frequency for height 136 cm is and soon.
The frequency distribution table is as given below:
Range of the above data = Highest value - Lowest value
= 142 - 135
= 7.
We also see that all frequencies when added given us the total number of observations.
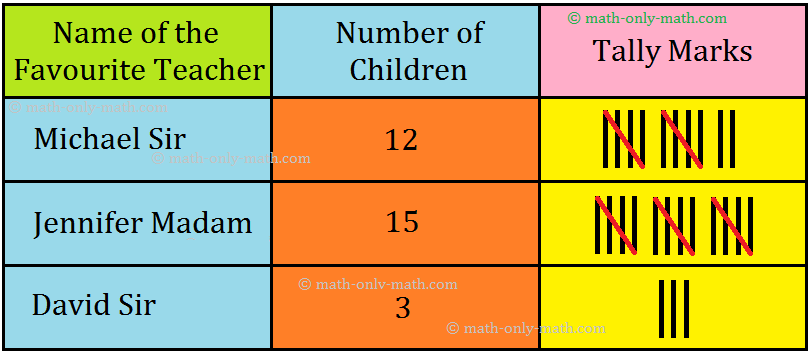
4. Out of total 30 students in a class, the favourite teacher of 12 students is Michael Sir, the favourite teacher of 15 students is Jennifer Madam and the favourites of 3 students is David Sir. Record the data using tally marks.
Solution:
Worksheet on Data Handling:
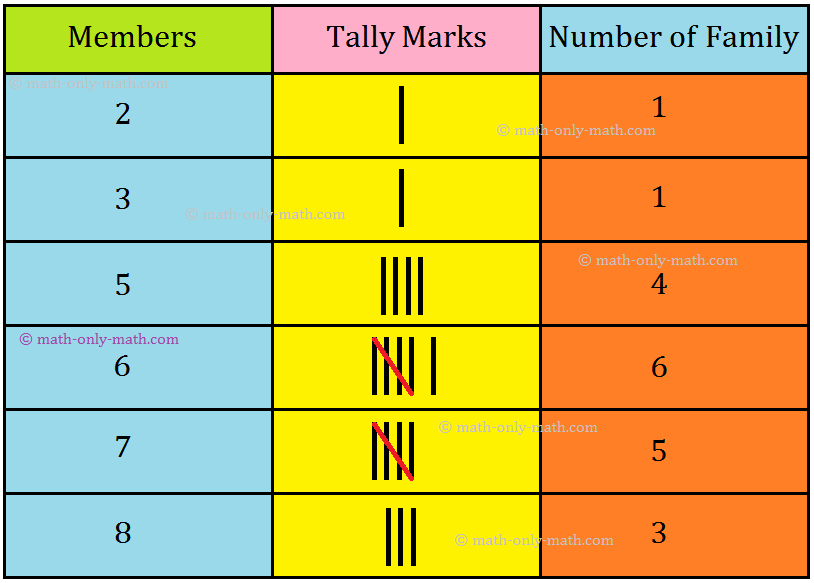
1. Following are the number of members in 20 families in a village:
7 6 2 5 7 5 8 6 6 8
3 8 7 6 6 7 6 7 5 5
Arrange the above data in an ascending order and then put it in the tabular form.
Answer:
2, 3, 5, 5, 5, 5, 6, 6, 6, 6,
6, 6, 7, 7, 7, 7, 7, 8, 8, 8.
2. The following are the ages (in years) of 12 teachers in a school.
36 44 39 46 35 53 38 42
55 45 49 40
Arrange the above data in an ascending order and answer the questions given below:
(i) What is the age of the eldest teacher in the school?
(ii) What is the age of the youngest teacher in the school?
Answer:
35, 36, 38, 39, 40, 42,
44, 45, 46, 49, 53, 55.
(i) 55
(ii) 35
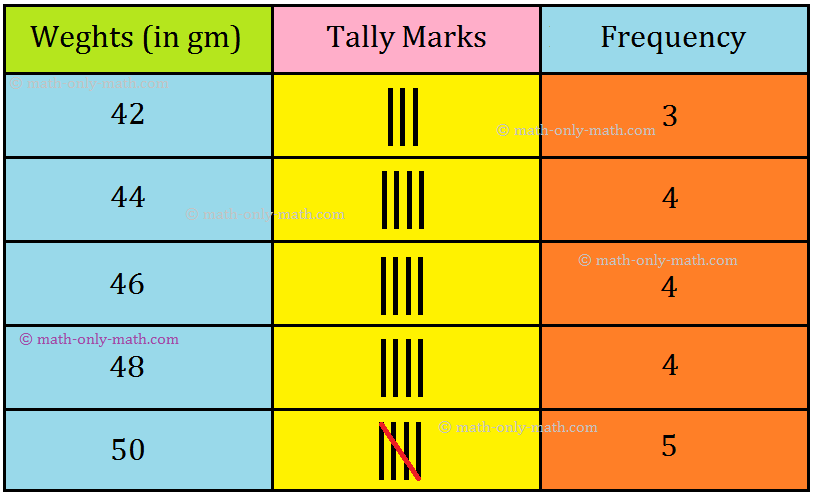
3. The weights of 20 marbles (in gram) are given below:
50 44 48 46 48 44 50 42
48 50 42 46 44 46 46 48
50 44 42
Prepare a frequency distribution table for the above data. What is the range of the data?
Answer:
In ascending order
42, 42, 42, 44, 44, 44, 44, 46, 46, 46, 46, 48, 48, 48, 50, 50, 50, 50, 50.
Range of the data = 50 - 42 = 8
Let Us Summarize What We Have Discussed Above:
👉 Collection of information in the form of numerical figures is called data.
👉 The number of times a particular observation occurs is called its frequency of distribution.
👉 The difference between the highest and the lowest values of the observations is called the range.
👉 Collection of information in the form of numerical figures is called data.
👉 The number of times a particular observation occurs is called its frequency of distribution.
👉 The difference between the higest and the lowest values of the observations is called the range.
👉 A bar graph is a way of representing numerical data by using pictures symbols.
👉 A bar graph is a chart with rectangular bars of equal width and length proportional to the values that they represent. The bars can be horizontal or vertical with equal spacing between them.
👉 Bar graph is also called column graph.
👉 Each rectangular or bar of a bar graph represents only one value of the numerical data and so there are as many bars as the number of values in the numerical data.
👉 The height or length of a bar indicates on a suitable scale the corresponding value of the numerical data.
● Data Handling
● Data Handling - Worksheet
From Data Handling to HOME PAGE
Didn't find what you were looking for? Or want to know more information about Math Only Math. Use this Google Search to find what you need.



New! Comments
Have your say about what you just read! Leave me a comment in the box below. Ask a Question or Answer a Question.