Subscribe to our ▶️ YouTube channel 🔴 for the latest videos, updates, and tips.
Interpreting a Pictograph
In interpreting a pictograph, we get a lot of information regarding the pictograph items. The following examples may illustrate the interpretation of pictographs.
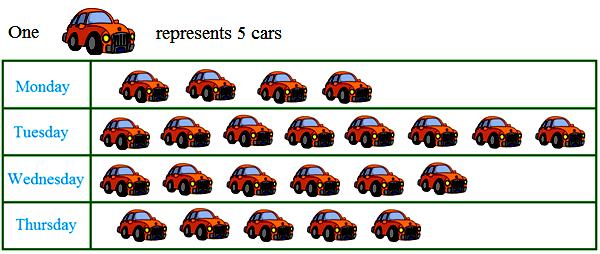
A. The following pictograph shows how many cars were washed at the washing center of a service station during four days of a week.
Solution:
We can get information from the pictograph by asking the following questions:
1. How many cars were washed on different days?
(On Monday 4 x 5 = 20 cars,
On Tuesday 8 x 5 = 40 cars,
On Wednesday 6 x 5 = 30 cars,
On Thursday 5 x 5 = 25 cars)
2. On which day were the maximum numbers of cars washed?
(On Tuesday maximum numbers of cars (40) were washed)
3. On which day were the minimum numbers of cars washed?
(On Monday: 20 cars)
4. How many more cars were washed on Tuesday than Wednesday?
(40 - 30 = 10 more cars)
5. How many total cars were washed in four days?
(20 + 40 + 30 + 25 = 115 cars)
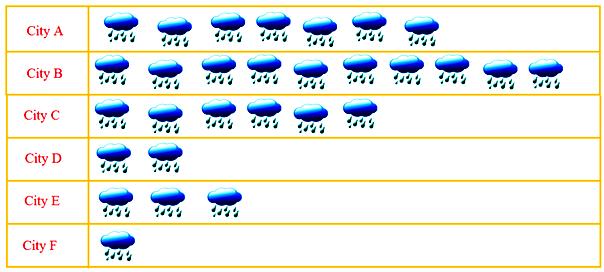
B. There is a pictograph showing rainfall of different cities
named (A, B, C, D, E and F) during the current year. On the basis of
this pictograph answer the following questions.
Solution:
This symbol represents 25 cm. of rainfall.
Pictograph showing rainfall in cm.
1. Give the information regarding rainfall in cities A, B, C, D, E and F in cm.
2. In which city was there maximum rainfall?
3. In which city was there minimum rainfall?
4. The city A recorded how much more rainfall than the city F?
5. Compare the rainfall between the city B and E.
Solution:
1. (i) In city A 7 x 25 = 175 cm
(ii) In city B 10 x 25 = 250 cm
(iii) In city C 6 x 25 = 150 cm
(iv) In city D 2 x 25 = 50 cm
(v) In city E 3 x 25 = 75 cm
(vi) In city F 1 x 25 = 25 cm
2. Maximum rainfall occurred in city B, i.e., 250 cm.
3. Minimum rainfall was in city F that is 25 cm.
4. Difference between rainfalls of city A and F = 175 - 25 = 150 cm.City A has more rainfall.
5. The rainfall in city B was 250 cm, and in city E it was 75 cm. So, city B recorded more rainfall than city E.
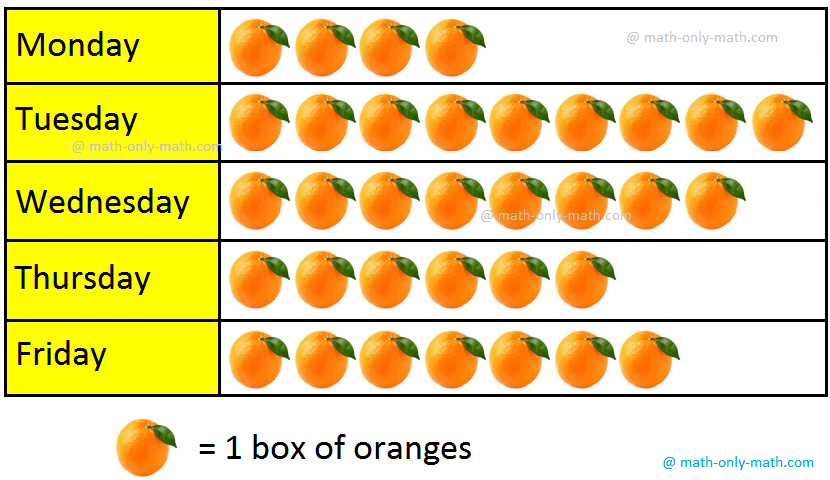
C. Orange sold during 5 days of a week.
Here, one 1 orange represents 1 box of oranges.
1. How many boxes of oranges did the fruit-seller sell in 5 days?
2. On which day was the sale of oranges maximum?
3. How many fewer boxes of oranges were sold on Friday than Tuesday?
4. What did he earn by selling oranges on Wednesday, if each box was sold for 105?
Solution:
1. 34 boxes
2. Tuesday
3. 9 - 7 = 2
4. 105 × 8 = 840
Related Concepts on Data Handling
● Pictograph to Represent The Collected Data
From Interpreting a Pictograph to HOME PAGE
Didn't find what you were looking for? Or want to know more information about Math Only Math. Use this Google Search to find what you need.


New! Comments
Have your say about what you just read! Leave me a comment in the box below. Ask a Question or Answer a Question.