Subscribe to our ▶️ YouTube channel 🔴 for the latest videos, updates, and tips.
Interpreting Bar Graph
We will learn interpreting bar graph collecting the given information.
Now let us interpret a bar graph.
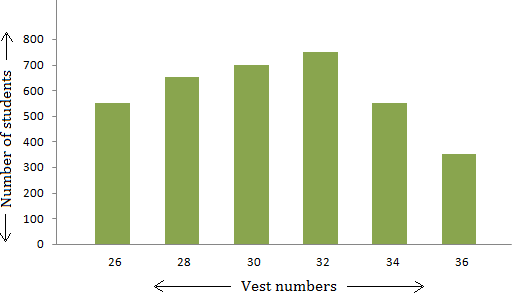
1. Observe the following bar graph representing the number of students wearing different sizes of vests (sizes in inches) in a middle school and answer the questions.
(i) Write the different sizes of vests worn by the students.
(ii) Write the number of students wearing vest size no. 28.
(iii) Which vest size is worn by the maximum number of students? Find the number also.
(iv) Which vest size is worn by the minimum number of students? Find the number also.
(v) Which vest size is worn by the same number of students? Find the number also.
Solution:
(i) The students wear sizes no. 26, 28, 30, 32, 34 and 36.
(ii) The number of students wearing vest size no. 28 is 650.
(iii) The vest size no. 32 is worn by the maximum number of students. The number is 750.
(iv) The vest size no. 36 is worn by the minimum number of students. The number is 350.
(v) Vest size no. 26 and 34 are worn by the same number of students. The number is 550.
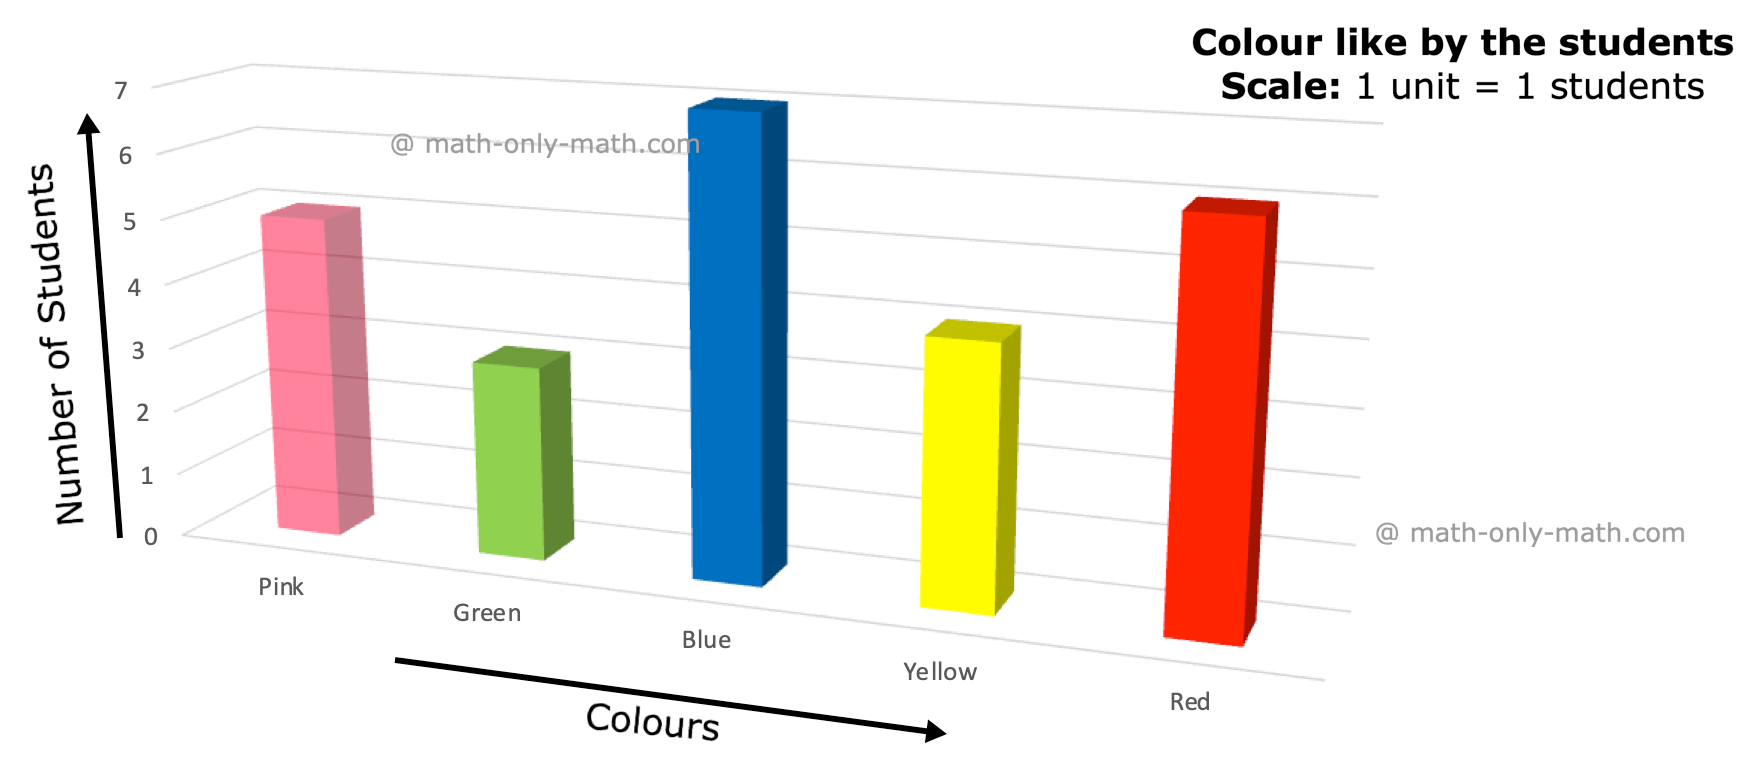
2. The following graph shows the colours liked by the students of a particular class.
(i) Which colour is liked most by the students?
(ii) Which colour is liked by the least number of students?
(iii) What is the total number of students who like green, yellow and blue colours?
Solution:
(i) Blue
(ii) Green
(iii) 3 + 4 + 7 = 14
Worksheet on Interpreting Bar Graph:
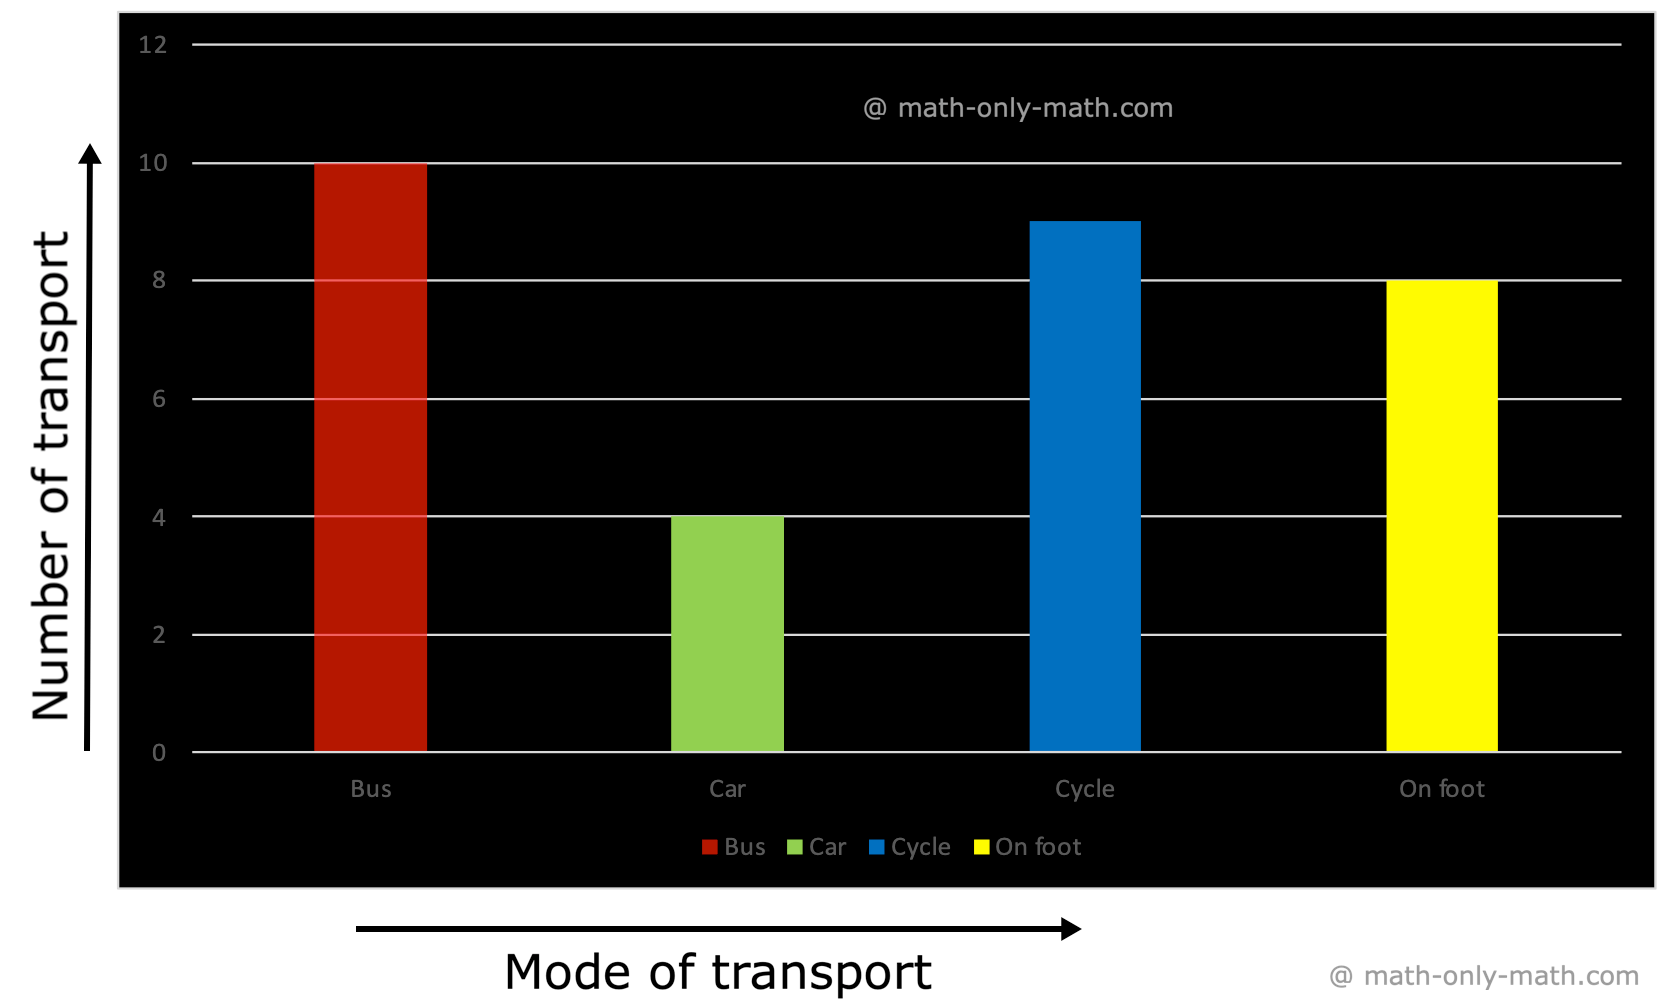
1. Study this bar graph which shows the mode of transport used by children to go to school:
Answer the questions that follow:
(i) Which is the most popular mode of transport?
(ii) How many students walk to go to school?
(iii) Which mode of transport is least used?
(iv) How many students use cycle to go to school?
Answer
1. (i) bus
(ii) 8 students
(iii) car
(iv) 9 students
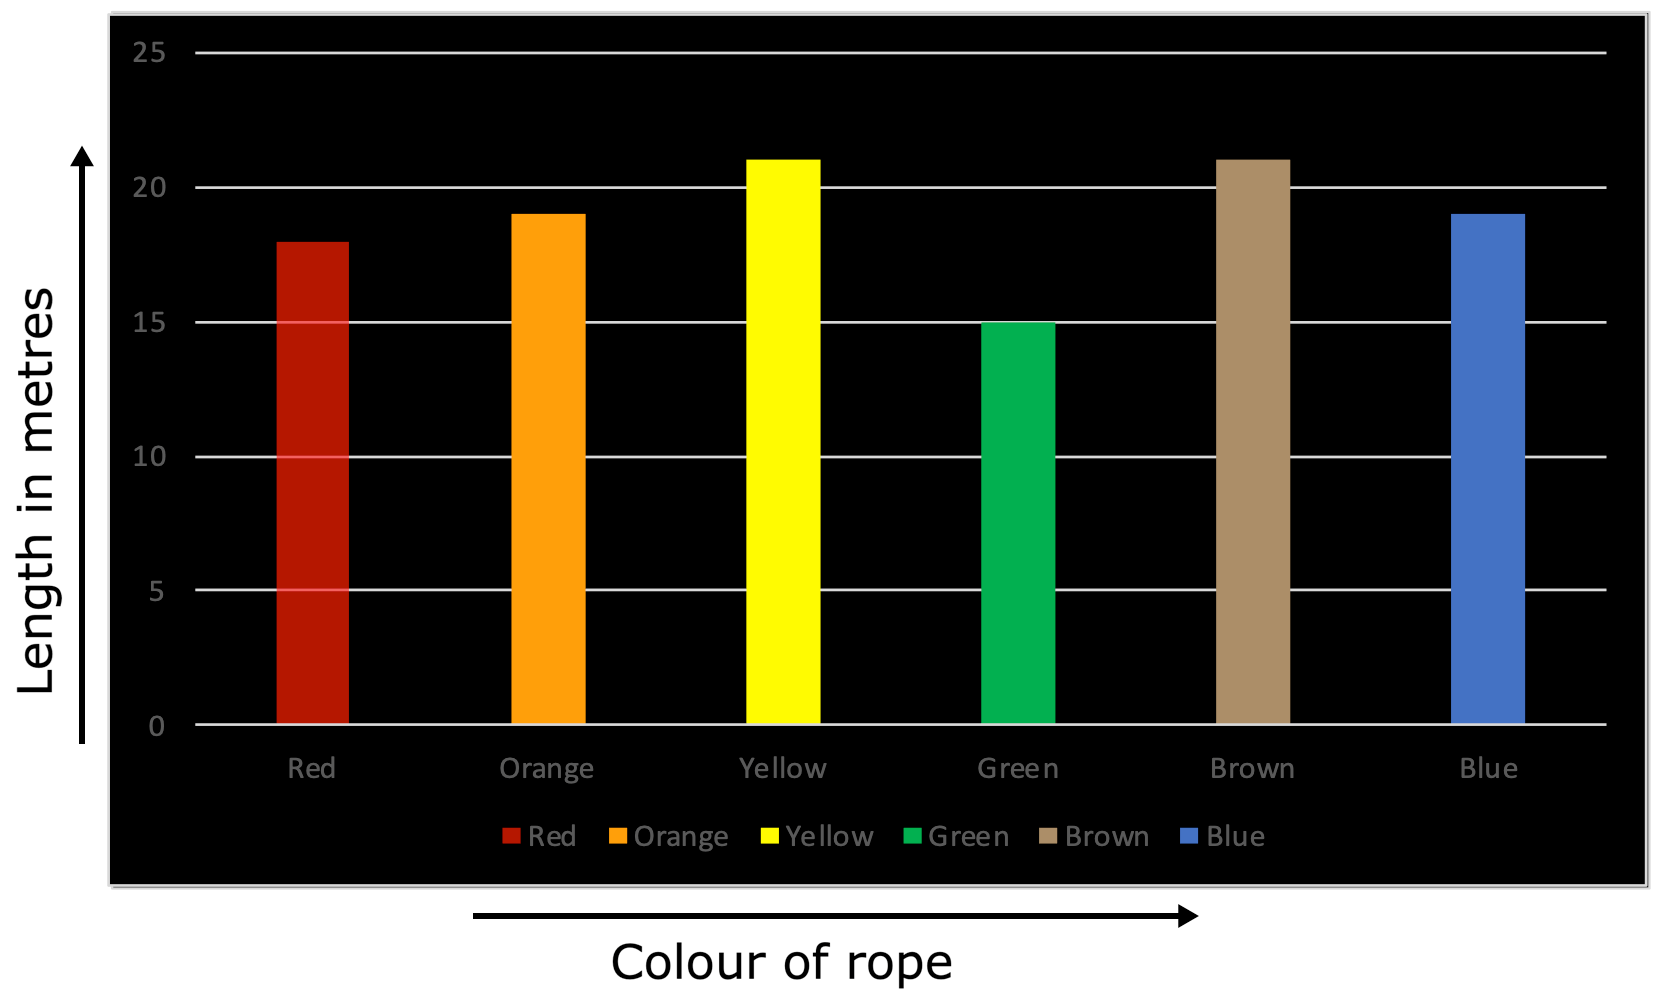
2. Study the bar graph and answer the following questions:
(i) Which piece of rope is 21 m long?
(ii) Which piece or pieces of rope are more than 18 metres long but less than 21 metres?
(iii) What is the length of the shortest rope?
(iv) What is the length of the red rope?
(v) Which rope is 19 cm long?
Answer
2. (i) Yellow and Brown
(ii) Orange and Blue
(iii) 15 m
(iv) 18 m
(v) Orange and Blue
From Interpreting Bar Graph to HOME PAGE
Didn't find what you were looking for? Or want to know more information about Math Only Math. Use this Google Search to find what you need.


New! Comments
Have your say about what you just read! Leave me a comment in the box below. Ask a Question or Answer a Question.