Subscribe to our ▶️ YouTube channel 🔴 for the latest videos, updates, and tips.
Pictorial Representation
Some basic ideas of pictorial representation or pictograph, often related types of symbols or pictures are used to represent a specific number of objects.
Data can be shown with the help of pictures. This type of representation is call pictograph.
For example, a symbol may represent 1 or 10 or 100 or 1000 or any other number of related objects. The symbol/picture used is very simple, clear and self explanatory. The quantity that each symbol represents is indicated clearly in the representation, i.e. the scale is mentioned clearly.
1. Examples of objects whose pictures or symbols are used are: different kinds of animals like birds, insects, men, women, boys, girls, fruits like mangoes, grapes, oranges, apples, trees, cars, scooters, bicycles, plants, etc.
2. The symbol or pictures may be colored. So such colors should be used which are very common, like red, blue, green, yellow, etc.
3. Only the pictures of common fruits are used such as banana, apples, guava, orange, grapes, mangoes, etc.
4. Sometimes the names of the month of a
year, or the days of a week need to be mentioned. The names of the months and
days may be written vertically and in front of each we may write the roll
numbers of the students according to their birthday and birth month. This way
we may show the number of students who are born in the month or day concerned.
5. Sometimes, data on yearly production such as the yearly production of wheat or rice in a state, of steel in a factory, etc., may have to be represented. Thus, we must be acquainted with the numbers used to describe the years 2007, 2008, 2009, 2010, 2011, 2012, etc.
So, pictures of different objects are used as a symbol to give information regarding mathematical data.
In short, the information presented through pictures or symbol of different objects is called pictorial representation of data. The pictures of different objects are used to represent different information, so such pictorial data are called pictographs.
Pictographs
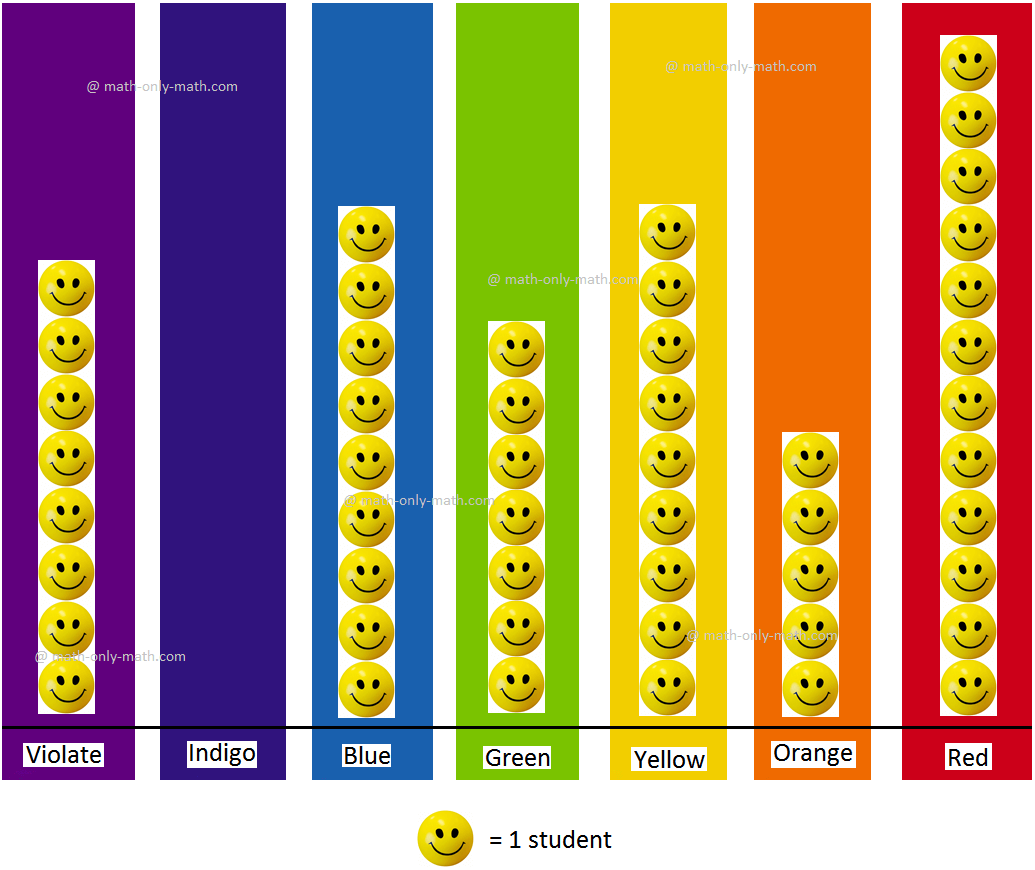
The students of Class 2 were asked to choose their favourite colour from the colours of the rainbow. The teacher then collected their response and made a chart to show the information.
My Colour of the Rainbow
In the chart, each smiling face represents a student. Such a chart that displays information using pictures is known as a pictograph.
Let us see what information we can gather from this pictograph.
Some information can be directly read from the pictograph.
1. The pictograph is titled 'My colour of the rainbow' and it shows us the favourite colour chosen by the students of Class 2.
2. Violet is the favourite colour of 8 students.
3. Indigo is the favourite colour of 0 students.
4. Blue is the favourite colour of 9 students. 5. Green is the favourite colour of 7 students.
6. Yellow is the favourite colour of 9 students.
7. Orange is the favourite colour of 5 students.
8. Red is the favourite colour of 12 students.
Some information can be understood after studying the pictograph.
1. Red is the most popular colour choice of the students.
2. Indigo is the least popular colour choice of the students.
3. An equal number of students chose yellow and blue as their favourite colours.
4. Between violet, green and orange, violet is the most popular colour.
5. Three more students chose violet than those who chose orange as their
favourite colour.
Sometimes, when the scores are high, it is not possible to draw so many pictures in a pictograph. In such pictographs one picture can be made to represent a score of more than one. This can be explained better using the example that follows.
Reading Pictograph:
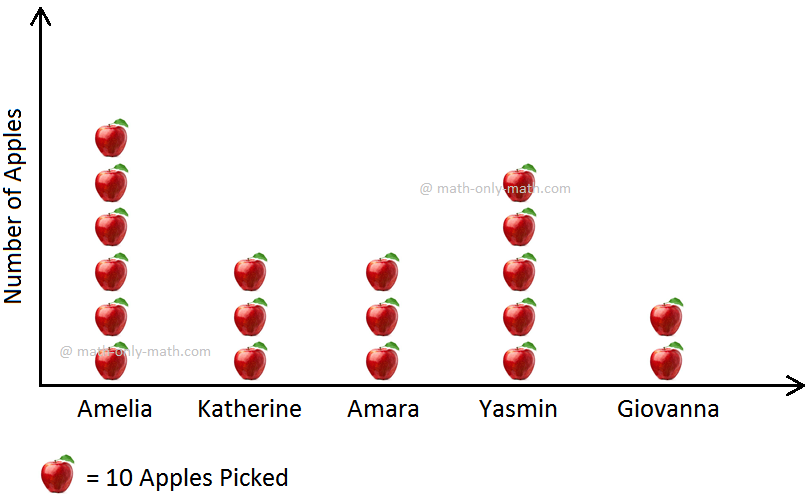
1. Five friends participated in an apple-picking competition. The result of the competition held in an orchard is shown in the pictograph below. Study the pictograph and answer the questions that follow.
Apple Picking Score
(i) Who picked the most number of apples?
Answer: The most number of apple pictures can be seen in Amelia's column. Thus, Amelia picked the most number of apples.
(ii) Who picked the least number of apples?
Answer: The least number of apple pictures can be seen in Giovanna's column. Thus, Giovanna picked the least number of apples.
(ii) Who picked an equal number of apples?
Answer: An equal number of apple pictures can be seen in Katherine and Amara's columns. Thus, Katherine and Amara picked an equal number of apples.
(iv) How many apples did Yasmin pick?
Answer: Five apple pictures can be seen in Yasmin's column. It is given in the pictograph that each apple picture stands for 10 apples picked.
Thus, Yasmin picked 5 × 10 = 50 apples.
(v) How many more apples did Katherine pick than Giovanna?
Answer: Compared to the two apple pictures in Giovanna's column, Katherine has three or one more picture. Thus, Katherine picked 1 × 10 = 10 more apples than Giovanna.
(vi) How many apples did Amelia pick?
Answer: Amelia picked 6 × 10 = 60 apples.
(vii) How many apples were picked in all by the five friends?
Answer: There are a total of 19 apple pictures against all the five friends. Thus, a total of 19 × 10 = 190 apples got picked by all the five friends.
(viii) How many apples did Amara and Giovanna pick together?
Answer: Amara picked 3 × 10 = 30 apples while Giovanna picked 2 × 10 = 20 apples. Together they picked 30 + 20 = 50 apples.
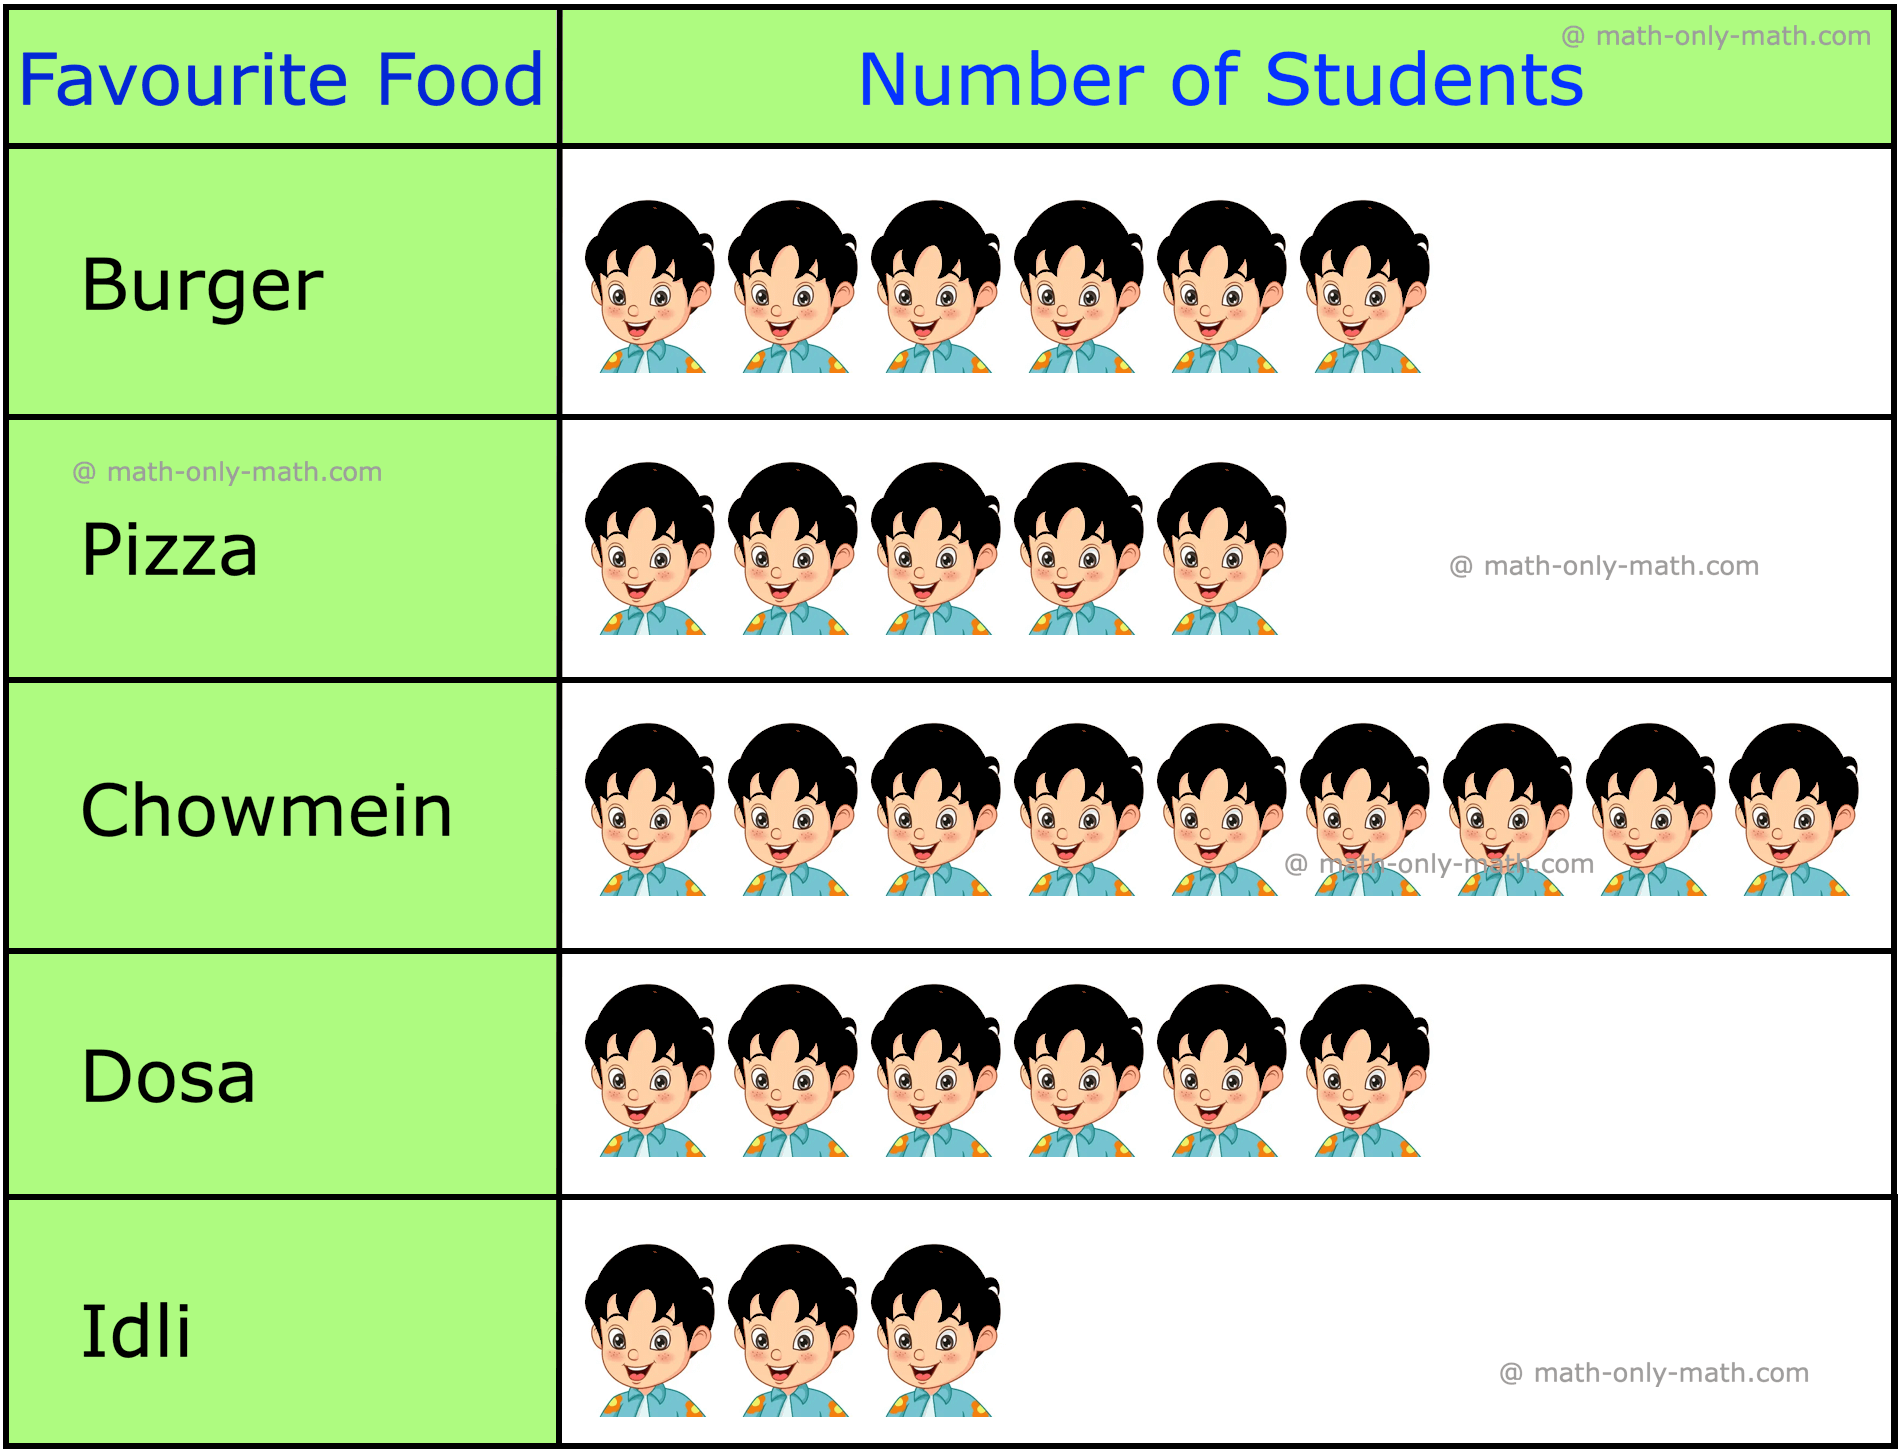
2. In a school the students of Class III - A were asked to name their favourite food.
Use information make a pictograph.
Favourite Food
Burger
Pizza
Chowmein
Dosa
Idli
Number of Students
6
5
9
6
3
Represent the information by means of pictograph.
Solution:
They decided to represent this information using pictures.
This representation is known as pictograph. It uses symbols to represent numbers.
Using the pictograph, we can easily answer the following questions:
(i) Which food is liked by most number of students?
Answer: Chowmein
(ii) How many students like Burger?
Answer: 6 students
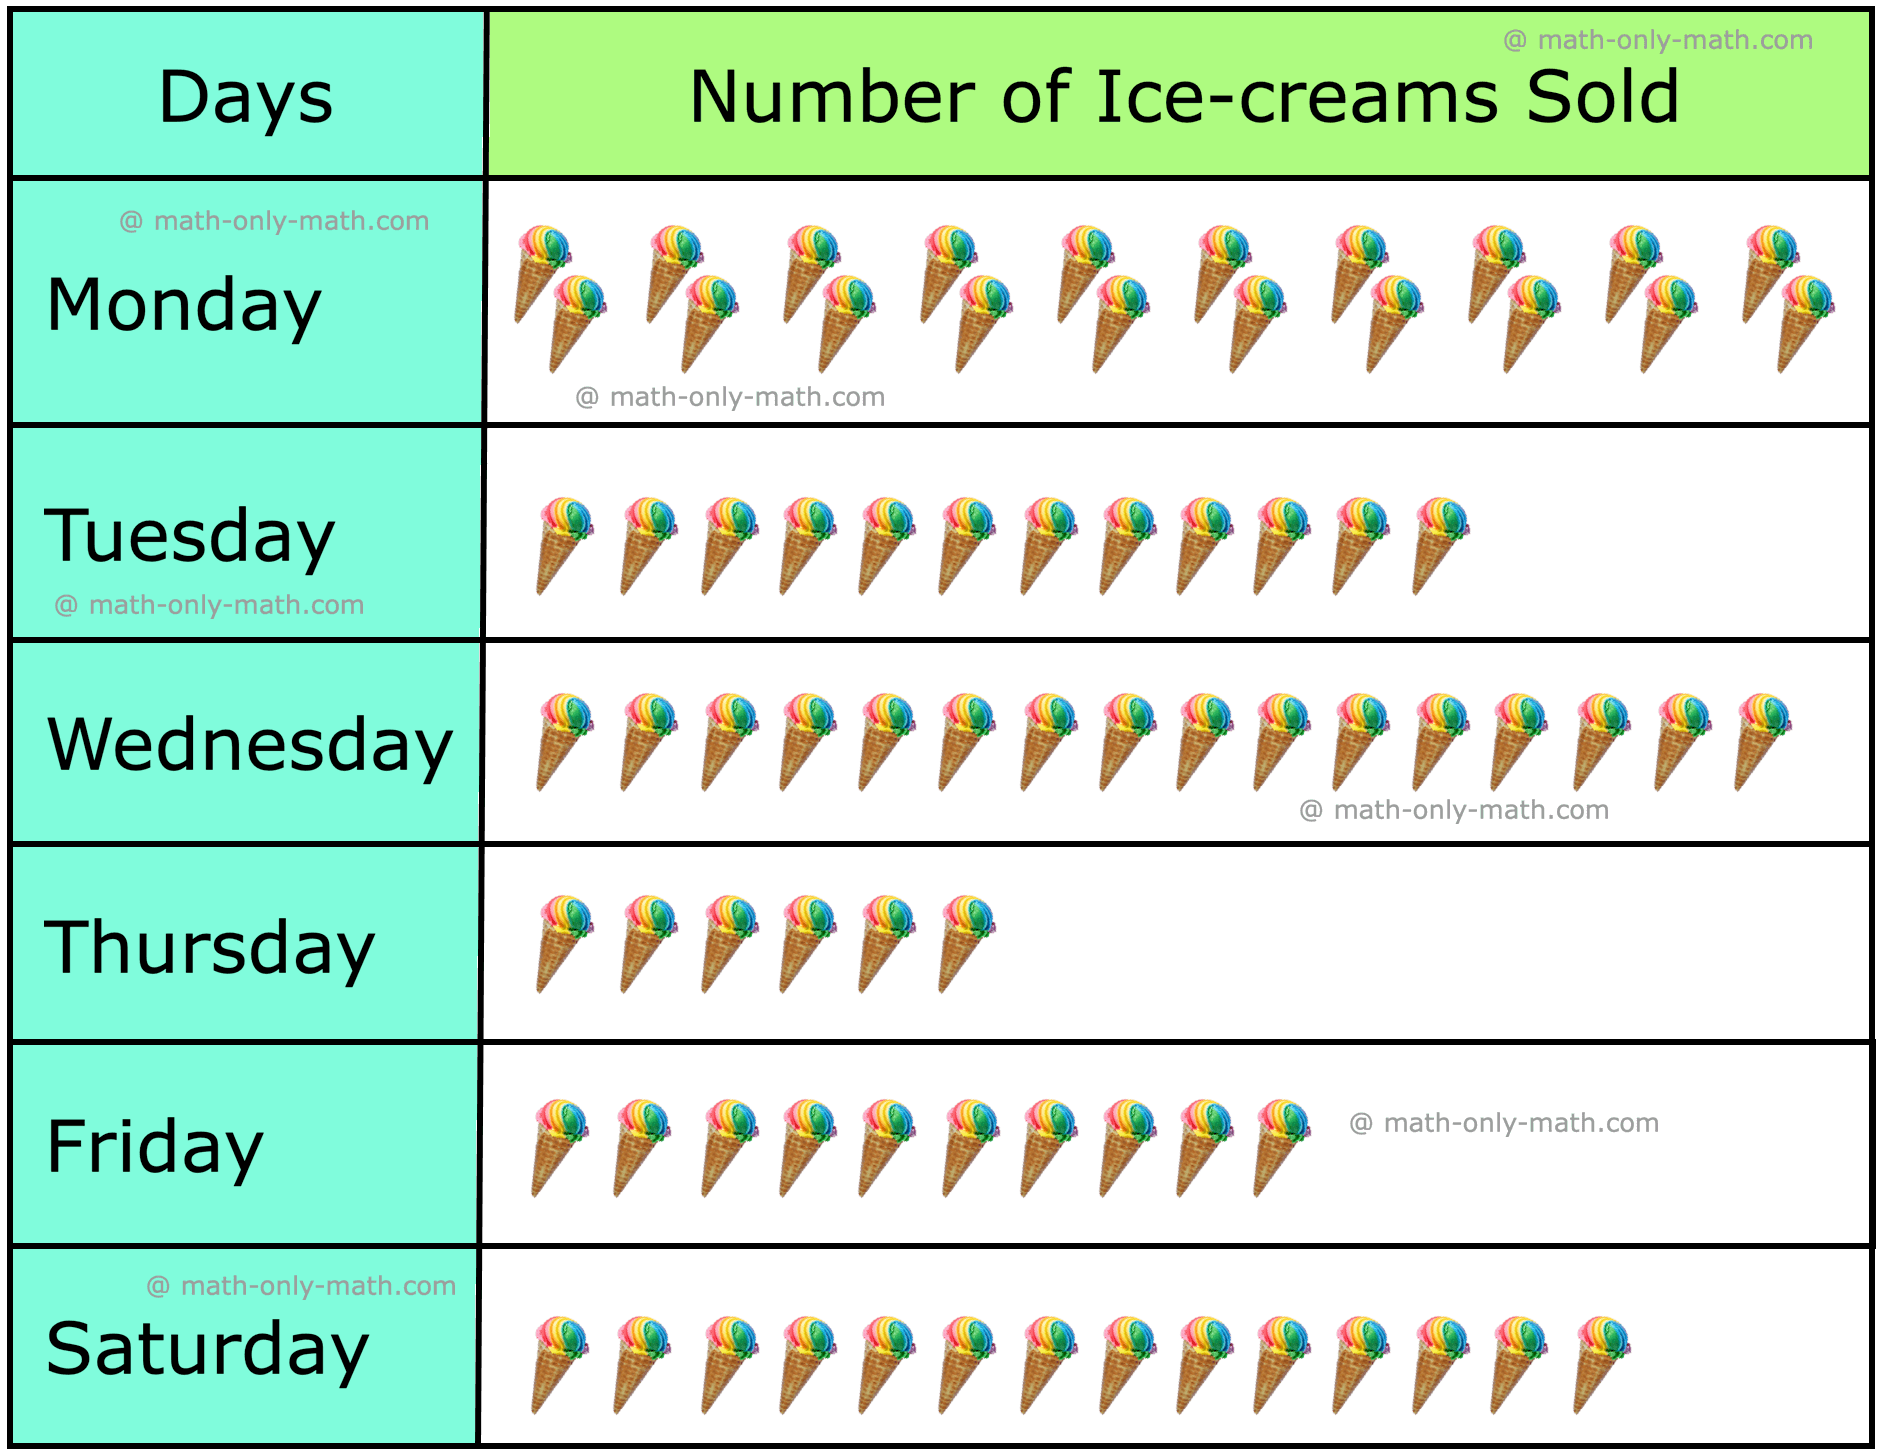
3. An ice-cream seller sold the following number of ice-creams during a week. Use the information to make a pictograph.
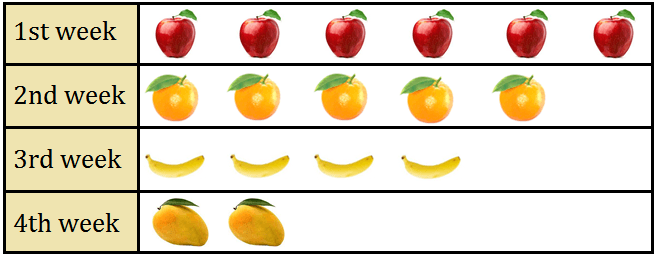
4. In the month of March Seema bought different types of fruits every week. Read the I pictograph and answer:
(i) Which week did she buy maximum fruits?
(ii) Which week did she buy 5 fruits?
(iii) How many weeks did she buy fruit?
(iv) Which week did she buy least fruits?
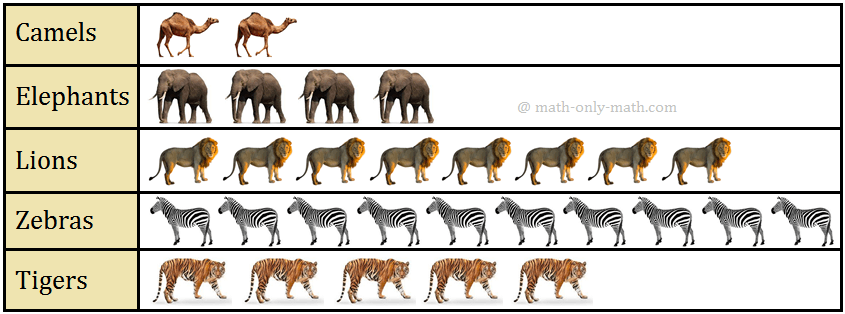
5. Read the pictograph given below and answer the question.
(Here 1 picture represents 5 animals.)
(i) What is the total number of animals?
(ii) Which kind of animal is least in number?
(iii) How many tigers are there?
(iv) How many herbivorous animals are there?
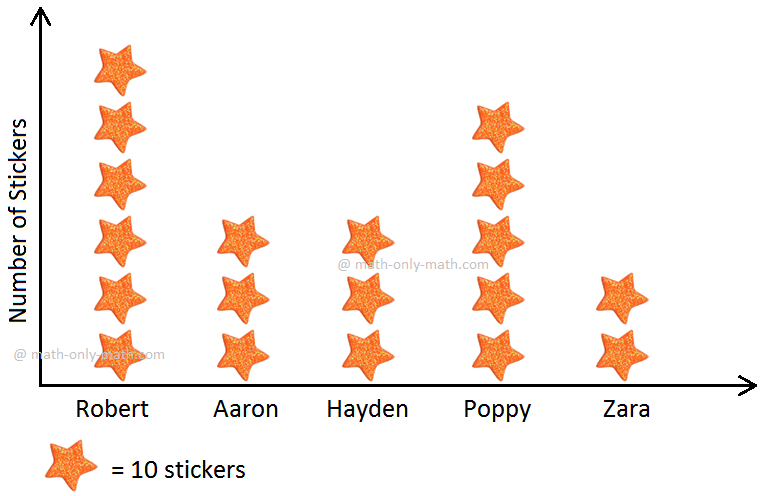
6. Make a pictograph to show the number of star stickers owned by five friends.
|
Robert Aaron Hayden Poppy Zara |
40 50 50 30 60 |
It would be very hard to show so many stickers against each friend. So, we can show one picture for every 10 stickers owned.
Star Stickers Owned by Five Friends
Pictorial Representation
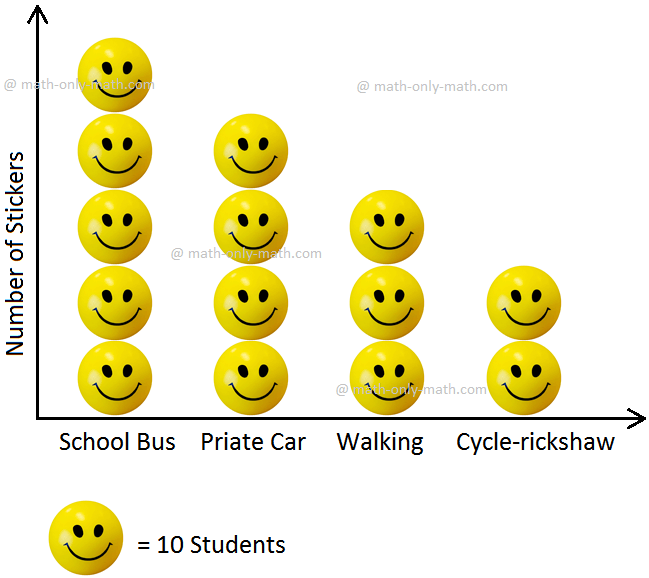
7. The mode of transport availed by the students of a preparatory school is put up in a chart on the wall as a pictograph. Study it and answer the questions that follow.
Mode of Transport Availed by the Students
(i) What is the title of this pictograph?
(ii) What does one smiling face represent?
(iii) Which is the most popular mode of transport for the students?
(iv) Which is the least popular mode of transport for the students?
(v) How many students travel by private cars?
(vi) How many students travel by a mode of transport that gives out no smoke and consumes no fuel?
(vii) How many students travel to school by a mode of transport that has an engine and consumes fuel?
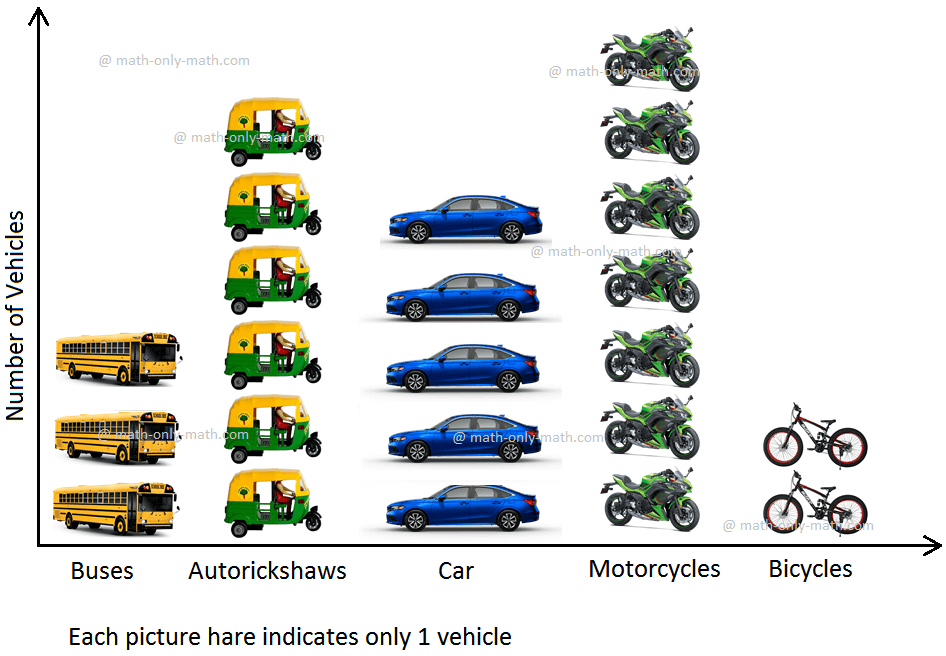
8. Standing at the bus stop waiting for his school bus, Robert counted all the vehicles that went past him in 10 minutes. He recorded his observations in the following pictograph. Answer the questions that follow.
Vehicles that Went Past in 10 Minutes
(i) How many different kinds of vehicles went past Robert?
(ii) Out of all the vehicles that went past Robert, which was the most in number?
(iii) Out of all the vehicles that went past Robert, which was the least in number?
(iv) How many buses went past Robert in 10 minutes?
(v) How many cars and bicycles went past Robert?
(vi) Which were most in number - two wheelers (motorcycles and bicycles), three wheelers (autorickshaws) or four wheelers (cars and buses)?
(vii) How many more cars than bicycles went past Robert?
(viii) How many vehicles in all went past Robert in 10 minutes?
Related Concepts
From Pictorial Representation to HOME PAGE
Didn't find what you were looking for? Or want to know more information about Math Only Math. Use this Google Search to find what you need.


New! Comments
Have your say about what you just read! Leave me a comment in the box below. Ask a Question or Answer a Question.