Subscribe to our ▶️YouTube channel🔴 for the latest videos, updates, and tips.
Home | About Us | Contact Us | Privacy | Math Blog
Construction of Pie Chart
Now we will discuss about the construction of pie chart or pie graph. In brief let us recall about, what is a pie chart?
The pie chart is a pictorial representation of data relative to a whole. Each portion in the circle represent an element of the collected data. The pie chart represents the composition of various elements in a whole. The total value of the pie chart is always 100%. Each portion in the circle shows a fraction or percentage of the total.
Pie chart is a circular graph which is used to represent data. In this :
● Various observations of the data are represented by the sectors of the circle.
● The total angle formed at the centre is 360°.
● The whole circle represents the sum of the values of all the components.
● The angle at the centre corresponding to the particular observation component is given by
● If the values of observation/components are expressed in percentage, then the centre angle corresponding to particular observation/component is given by
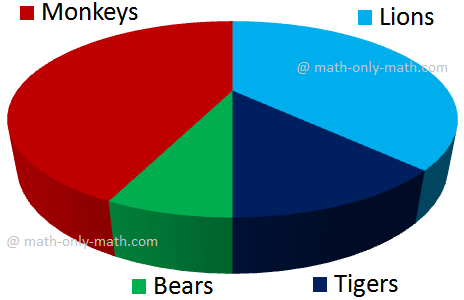
Like bar graphs, circle charts are also used for representing and comparing information.
Look at the given example.

This circle chart shows the favourite subject of students in class IV-A.
The yellow part of the circle is the biggest showing that most of the students like science.
The blue part of the circle is the smallest showing that the least number of students like English as a subject.
How to construct a pie chart?
Steps of construction of pie chart for a given data:
● Find the central angle for each component using the formula given on the previous page.
● Draw a circle of any radius.
● Draw a horizontal radius
● Starting with the horizontal radius, draw radii, making central angles corresponding to the values of respective components.
● Repeat the process for all the components of the given data.
● These radii divide the whole circle into various sectors.
● Now, shade the sectors with different colors to denote various components.
● Thus, we obtain the required pie chart.
Here the pie chart shows the type of books preferred by the students of a class.
Given below is a pie chart showing the type of books preferred by the students of a class. Observe the chart and answer the questions given below.

(i) What fraction of students like Comic books?
Answer: The sector in the pie chart shows = 14
(ii) What fraction of students like Story books?
Answer: The sector in the pie chart shows = 12
(iii) Which 2 books have equal fraction of preference?
Answer: Poem and Puzzle books.
(iv) What fraction of students does not like story books?
Answer: 12
(iv) Which type of book do you like to read?
Answer: Comic books
Solved Example on Construction of Pie Chart/Pie Graph:
1. The following table shows the numbers of hours spent by a child on different events on a working day.
Represent the adjoining information on a pie chart
| Activity | No. of Hours |
| School | 6 |
| Sleep | 8 |
| Playing | 2 |
| Study | 4 |
| T. V. | 1 |
| Others | 3 |
The central angles for various observations can be calculated as:
| Activity | No. of Hours | Measure of central angle |
| School | 6 | (6/24 × 360)° = 90° |
| Sleep | 8 | (8/24 × 360)° = 120° |
| Playing | 2 | (2/24 × 360)° = 30° |
| Study | 4 | (4/24 × 360)° = 60° |
| T. V. | 1 | (1/24 × 360)° = 15° |
| Others | 3 | (3/24 × 360)° = 45° |
Now, we shall represent these angles within the circle as different sectors. Then we now make the pie chart:

2. The favourite flavours of ice-cream for the children in a locality are given in percentage as follow. Draw the pie chart to represent the given information
| Flavours | % of Students Prefer the Flavours |
| Vanilla | 25 % |
| Strawberry | 15 % |
| Chocolate | 10 % |
| Kesar-Pista | 30 % |
| Mango Zap | 20 % |
The central angles for various observations can be calculated as:
| Flavours | % of Students Prefer the Flavours | Measure of Central Angles |
| Vanilla | 25 % | (25/100 × 360)° = 90° |
| Strawberry | 15 % | (15/100 × 360)° = 54° |
| Chocolate | 10 % | (10/100 × 360)° = 36° |
| Kesar-Pista | 30 % | (30/100 × 360)° = 108° |
| Mango Zap | 20 % | (20/100 × 360)° = 72° |
Now, we shall represent these angles within a circle to obtain the required pie graph.

Worksheet on Construction of Pie Chart:
1. 80 girls were asked about their favourite sport? The collected information is given in the table. Read the information and label the graph.
|
Sports |
Number of Girls |
|
Badminton |
41 |
|
Tennis |
9 |
|
Swimming |
23 |
|
Volleyball |
7 |

Answer:

2. 100 students of a school were surveyed for their favourite activity. The information is represented in a pie chart as given below. Observe the chart and answer the questions given below.

(i) Which is the most favourite pastime activity of students?
(ii) How many students like music?
(iii) What percentage of students like to dance?
(iv) What percentage of students like to read books?
Answers:
(i) Playing Outdoor games
(ii) 25
(iii) 12.5%
(iv) 12.5%
You might like these
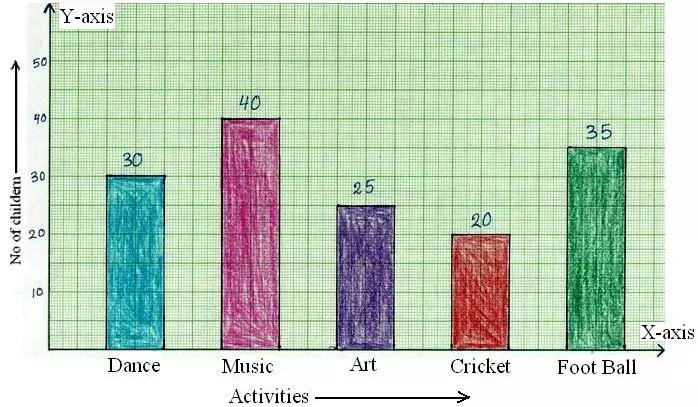
Construction of Bar Graphs | Examples on Construction of Column Graph
Now we will discuss about the construction of bar graphs or column graph. In brief let us recall about, what is bar graph? Bar graph is the simplest way to represent a data. In consists of rectangular bars of equal width. The space between the two consecutive bars must be
5th Grade Bar Graph | Definition | Interpret Bar Graphs|Free Worksheet
We learn how to represent the data on the bar graph. Data can be represented by bars (like rectangle) whose lengths represent numerical values. One can use horizontal or vertical bars. Instead of rectangles one way even use line segments in such graphs.
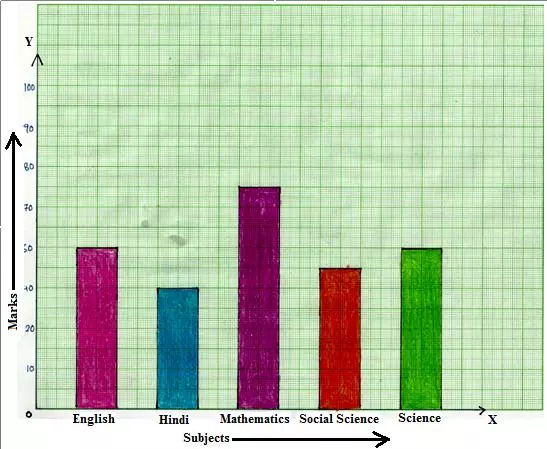
Interpreting Bar Graph | How to Read a Bar Graph? |Reading a Bar Graph
We will learn interpreting bar graph collecting the given information. Now let us interpret a bar graph. Observe the following bar graph representing the number of students wearing different
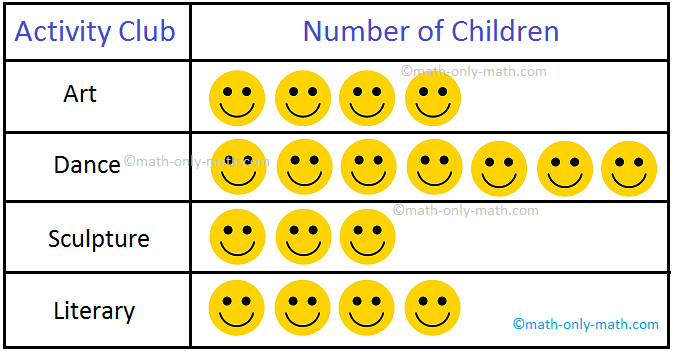
Worksheet on Pictographs | Picture Graph Worksheets | Pictograph Works
In worksheet on pictographs, all grade students can practice the questions on data handling. We can present the given information in many ways. In pictograph the information is presented by using a picture as symbol. A pictograph has a title and a key.
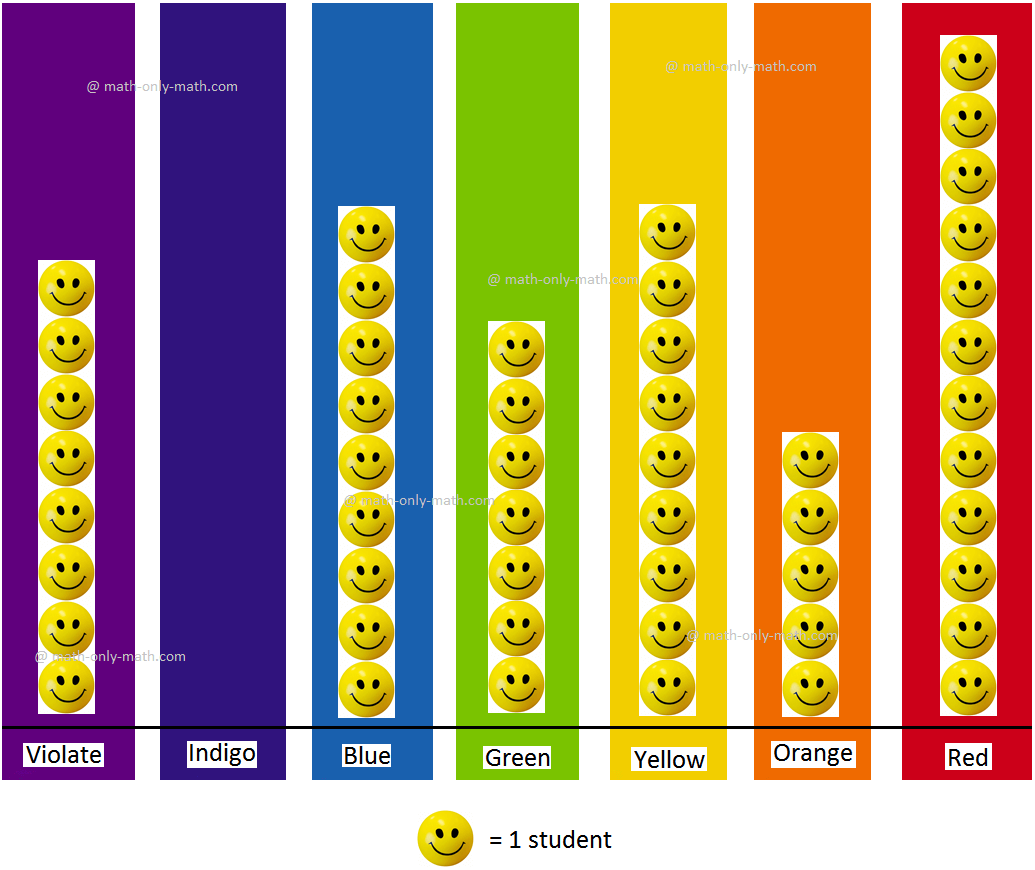
Pictorial Representation |Pictograph Worksheet |Representation of Data
Some basic ideas of pictorial representation or pictograph, often related types of symbols or pictures are used to represent a specific number of objects.
2nd Grade Data Handling | Collection of Objects |Information Collected
We have learnt, that a collection of objects can be stored out based on their color, shape, size or any other common thing among them. We can organise all the information in a table to understand how many of each item is there in a collection. Information collected is called
Worksheet on Bar Graphs | Bar Graphs or Column Graphs | Graphing Bar
In math worksheet on bar graphs students can practice the questions on how to make and read bar graphs or column graphs. Test your knowledge by practicing this graphing worksheet where we will
Worksheet on Data Handling | Questions on Handling Data |Grouping Data
In math practice worksheet on data handling we will solve numerous types of questions on handling data, frequency distribution and on grouping data. Questions on frequency distribution
Data Handling | Data Analysis | Data Processing | Numerical Data | Def
In data handling we will learn how to do data analysis or data processing while handling data in mathematics. What is data handling in math? In various fields, we need information
Pictographs | Pictorial Representation | Pictorial Symbols | Symbols
In pictographs we learnt to recognize different things in our surroundings and to express the given information through pictorial symbols of different objects.
Worksheet on Pie Chart | Questions on Pie Graphs | Creating Pie Chart
In math worksheet on pie chart students can practice different types of questions on pie graphs. From the given data we need to calculate the central angle of the components to construct the questions
Interpreting a Pictograph | Information Regarding the Pictograph |Math
In interpreting a pictograph, we get a lot of information regarding the pictograph items. The following examples may illustrate the interpretation of pictographs.
Pictograph to Represent The Collected Data | Forming Pictograph | Math
Pictures or symbols are made in a pictograph to represent the collected data. So, we can say that a pictograph represents the data and gives information quickly and clearly.
Examples of Pictographs |Pictorial Representation|Pictograph Questions
Some sample examples of pictographs or pictorial representation are shown, how the objects are used to give information regarding mathematical data. Read the pictograph and gather the information


● Statistics
-
Real Life Statistics
- Terms Related to Statistics
- Frequency Distribution of Ungrouped and Grouped Data
- Use of Tally Marks
- Class Limits in Exclusive and Inclusive Form
- Construction of Bar Graphs
- Mean
- Mean of the Tabulated Data
- Mode
- Median
- Construction of Pie Chart
- How to Construct a Line Graph?
From Construction of Pie Chart to HOME PAGE
Didn't find what you were looking for? Or want to know more information about Math Only Math. Use this Google Search to find what you need.

Recent Articles
-
Volume of a Cuboid | Volume of Cuboid Formula | How to Find the Volume
Jul 20, 25 12:58 PM
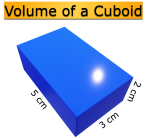 Cuboid is a solid box whose every surface is a rectangle of same area or different areas. A cuboid will have a length, breadth and height. Hence we can conclude that volume is 3 dimensional. To measur…
 -
5th Grade Volume | Units of Volume | Measurement of Volume|Cubic Units
Jul 20, 25 10:22 AM
 Volume is the amount of space enclosed by an object or shape, how much 3-dimensional space (length, height, and width) it occupies. A flat shape like triangle, square and rectangle occupies surface on…
 -
Worksheet on Area of a Square and Rectangle | Area of Squares & Rectan
Jul 19, 25 05:00 AM
 We will practice the questions given in the worksheet on area of a square and rectangle. We know the amount of surface that a plane figure covers is called its area. 1. Find the area of the square len…
 -
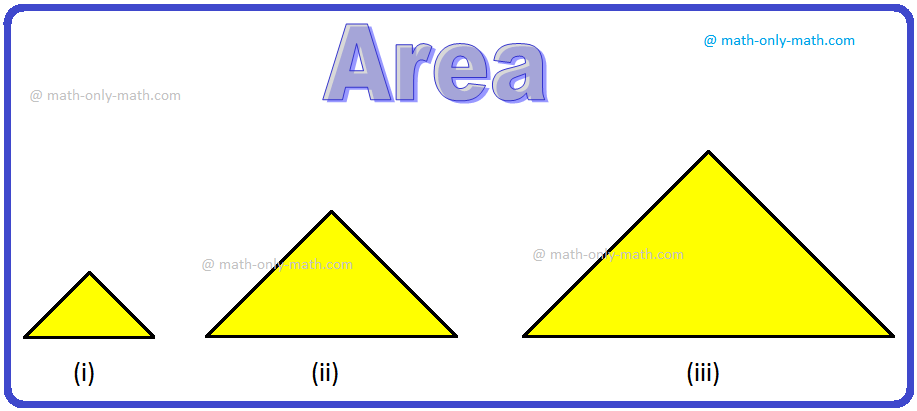
Area of Rectangle Square and Triangle | Formulas| Area of Plane Shapes
Jul 18, 25 10:38 AM
 Area of a closed plane figure is the amount of surface enclosed within its boundary. Look at the given figures. The shaded region of each figure denotes its area. The standard unit, generally used for…
 -
What is Area in Maths? | Units to find Area | Conversion Table of Area
Jul 17, 25 01:06 AM
 The amount of surface that a plane figure covers is called its area. It’s unit is square centimeters or square meters etc. A rectangle, a square, a triangle and a circle are all examples of closed pla…
New! Comments
Have your say about what you just read! Leave me a comment in the box below. Ask a Question or Answer a Question.