Subscribe to our ▶️ YouTube channel 🔴 for the latest videos, updates, and tips.
Line Graph
Bar graphs are used to compare changes between different groups. Line graphs are used to compare two variables.
The data which changes over a period of time can be displayed through a line graph.
In line graph:
● Points are plotted on the graph related to two variables
● Points are joined by the line segments.
How to Construct a Line Graph?
Steps of construction of line graph:
On a graph, draw two lines perpendicular to each other intersecting at O. The horizontal line is x-axis and vertical line is y-axis. Mark points at equal intervals along x-axis and write the names of the data items whose values are to be marked.
Along the y-axis, choose an appropriate scale considering the given values.
Now, make the points
Join each point with the successive point using a ruler. Thus, a line graph is obtained
Solve Examples on Line Graph:
For example a line graph given below shows how Elizabeth's height changes as she grows.
1. Given below is a line graph showing the height changes in Elizabeth as she grows. Observe the graph and answer the questions below.
(i) What was the height of Elizabeth at 8 years?
Answer: 65 inches
(ii) What was the height of Elizabeth at 6 years?
Answer: 50 inches
(iii) What was the height of Elizabeth at 2 years?
Answer: 35 inches
(iv) How much has Elizabeth grown from 2 to 8 years?
Answer: 30 inches
(v) When was Elizabeth 35 inches tall?
Answer: 2 years.
2. The following table gives the information of the sum scored by McKay in 10 matches. Represent this information using line graph.
| Match | 1 | 2 | 3 | 4 | 5 | 6 | 7 | 8 | 9 | 10 |
| Runs Scored | 80 | 30 | 50 | 90 | 40 | 60 | 75 | 20 | 15 | 90 |

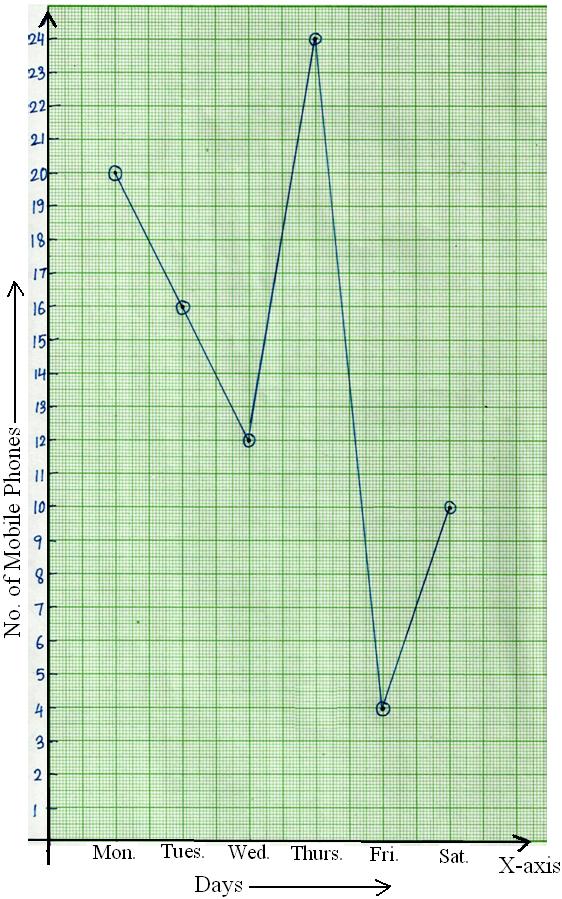
3. Mobile phones sold by a shop in a certain week are as follows:
| Days | Mon. | Tues. | Wed. | Thurs. | Fri. | Sat. |
| No. of Mobile Phones Sold | 20 | 16 | 12 | 24 | 4 | 10 |
Represent the above data by a line graph.

Questions and Answers on Line Graph:
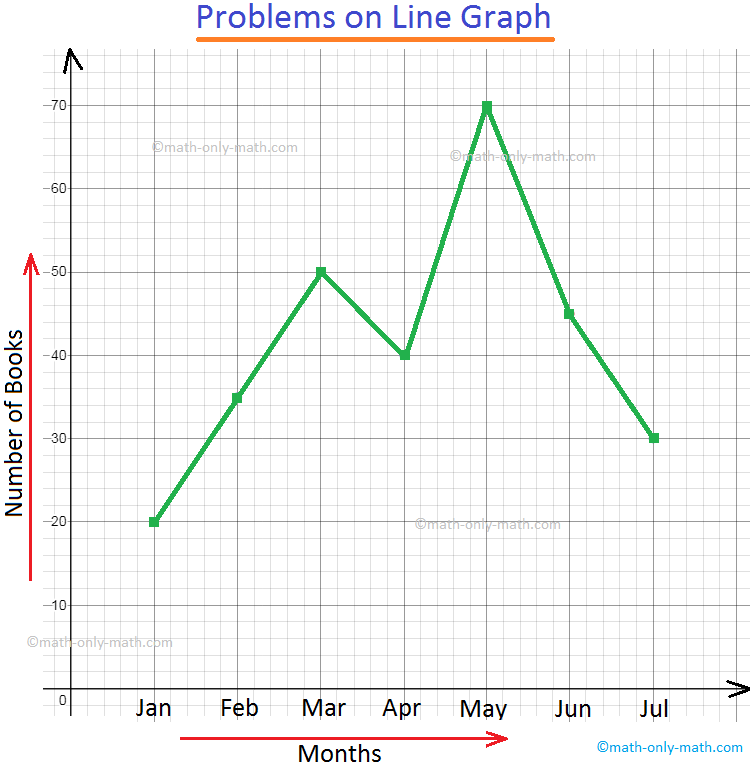
1. Given below is a line graph showing the sale of books in different months.
Observe the graph and answer the questions below.
(i) How many books are sold in the month of July?
(ii) In which of the months maximum numbers of books were sold?
(iii) In which of the months minimum numbers of books were sold?
(iv) How many books were sold in the first 3 months of the year?
(v) What was the decrease in the sale from May to June?
Answers:
(i) 30
(ii) May
(iii) January
(iv) 105
(v) 25
● Statistics
-
Real Life Statistics
- Terms Related to Statistics
- Frequency Distribution of Ungrouped and Grouped Data
- Use of Tally Marks
- Class Limits in Exclusive and Inclusive Form
- Construction of Bar Graphs
- Mean
- Mean of the Tabulated Data
- Mode
- Median
- Construction of Pie Chart
- How to Construct a Line Graph?
Didn't find what you were looking for? Or want to know more information about Math Only Math. Use this Google Search to find what you need.


New! Comments
Have your say about what you just read! Leave me a comment in the box below. Ask a Question or Answer a Question.