Subscribe to our ▶️ YouTube channel 🔴 for the latest videos, updates, and tips.
Frequency Distribution of
Ungrouped and Grouped Data
Frequency distribution of ungrouped and grouped data is discussed below with examples.
Frequency distribution of ungrouped data:
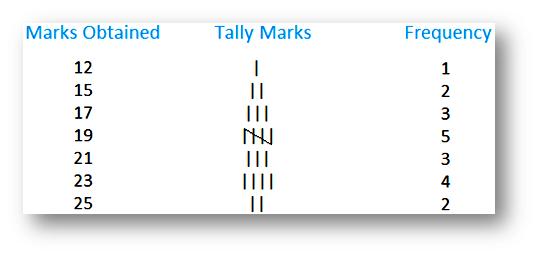
Given below are marks obtained by 20 students in Math out of 25.
21, 23, 19, 17, 12, 15, 15, 17, 17, 19, 23, 23, 21, 23, 25, 25, 21, 19, 19, 19
Frequency distribution of grouped data:
The presentation of the above data can be expressed into groups. These groups are called classes or the class interval.
Each class interval is bounded by two figures called the class limits.
Marks
0 - 10 10 - 20 20 - 30 |
Number of Students
|
Note: The lower value of a class interval is called lower limit and upper value of that class interval is called the upper limit. Thus, each class interval has lower and upper limits.
For Example:
In the class interval 10 - 20, 10 is the lower limit and 20 is the upper limit.
Exclusive form of data:
This above table is expressed in the exclusive form.
In this, the class intervals are 0 - 10, 10 - 20, 20 - 30. In this, we include lower limit but exclude upper limit.
So, 10 - 20 means values from 10 and more but less than 20.
20 - 30 would mean values from 20 and more but less than 30.
Data in the inclusive form:
Marks obtained by 20 students of class VIII in Math text are given below.
23, 0, 14, 10, 15, 3, 8, 16, 18, 20, 1, 3, 20, 23, 24, 15, 24, 22, 14, 13
Let us represent this data in the inclusive form.
Marks
0 - 10 11 - 20 21 - 30 |
Number of Students
|
Here, also we arrange the data into different groups called class intervals, i.e., 0 - 10, 11 - 20, 21 - 30.
0 to 10 means between 0 and 10 including 0 and 10.
Here, 0 is the lower limit and 10 is the upper limit. 11 to 20 means between 11 and 20 including 11 and 20.
Here, 11 is the lower limit and 20 is the upper limit.
When the data is expressed in the inclusive form, it is converted to exclusive form by subtracting 0.5 from lower limit and adding it to upper limit of each class interval.
11 - 20 is expressed in the inclusive form which can be changed and taken as 10.5 - 20.5 which is the exclusive form of the data.
Similarly, 21 - 30 can be taken as 20.5 - 30.5.
The above illustrative examples on frequency distribution of ungrouped and grouped data are explained above to get the clear concept.
● Statistics
-
Real Life Statistics
- Terms Related to Statistics
- Frequency Distribution of Ungrouped and Grouped Data
- Use of Tally Marks
- Class Limits in Exclusive and Inclusive Form
- Construction of Bar Graphs
- Mean
- Mean of the Tabulated Data
- Mode
- Median
- Construction of Pie Chart
- How to Construct a Line Graph?
From Frequency Distribution of Ungrouped and Grouped Data to
Didn't find what you were looking for? Or want to know more information about Math Only Math. Use this Google Search to find what you need.


