Subscribe to our ▶️ YouTube channel 🔴 for the latest videos, updates, and tips.
Home | About Us | Contact Us | Privacy | Math Blog
5th Grade Bar Graph
We learn how to represent the data on the bar graph.
Bar graphs are one of the many methods used to present data in a visual form. Bar graphs usually present data grouped in intervals, which depicts the frequencies of values in a particular interval.
Data can be represented by bars (like rectangle) whose lengths represent numerical values. One can use horizontal or vertical bars. Instead of rectangles one way even use line segments in such graphs.
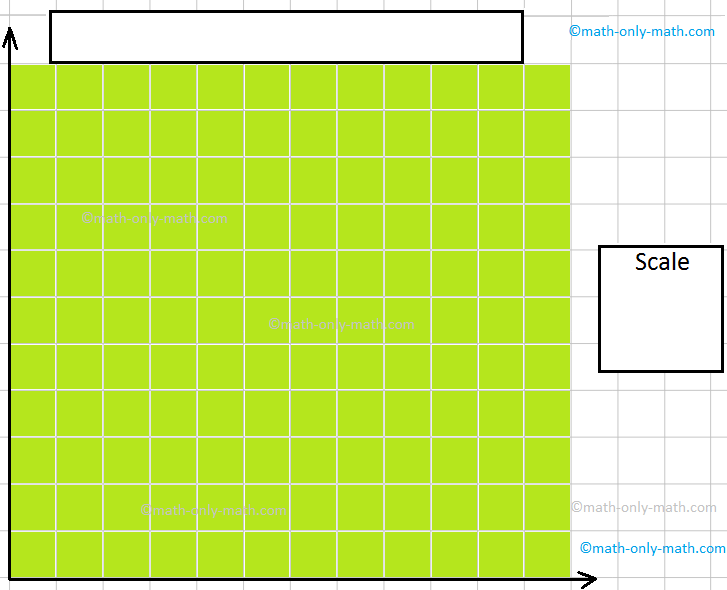
We can also represent data pictorically with the help of a bar graph. To draw a bar graph, we need two lines-one horizontal line and the other vertical line. It also consists of vertical or horizontal bars, the length of these bars depend on the amount or quantities that are to be represented. There should be equal intervals between the numbers written on both vertical as well as on the horizontal lines. A bar graph has title and a scale. Bar graphs make it easy to compare the recorded data. Let us read a bar graph.
Definition of Bar Graph:
A bar graph is a chart with rectangular barz of equal width and length proportional to the values that they represent. The bars can be horizontal or vertical with equal spacing between them.
It is also called column group.
Each rectangle or bar represents only one value of the numerical data. So there are as many bars as the number of value in the numerical data. The height or length of a bar indicates on a suitable scale the corresponding value of the numerical data
Scale of a Bar Graph:
To represent different numbers, first we need to decide what number a unit length of the bar represents. For example, if the data is of the population of villages, we can choose 1 cm of the bar to represent 500 people. This relation between the unit length of the bar and the quantity it represents is called the scale of the bar graph. The chosen scale is sometimes mentioned in the bar graph. In this case, the scale would be written as 1 cm : 500 people.
One can choose any scale for a graph. Obviously, the scale should be such that all the base of the graph fit on the paper on which it is drawn.
Interval is the space between each value on the scale of a bar graph. They are chosen based on the range of the values in the data set.
Reading and Interpreting a Bar Graph:
To read a bar graph, we proceed as per the following steps:
Step I: Know what it represents or what is the information given by it. For this, we read captions which are generally written just below the horizontal line and adjacen vertical line.
Step II: After knowing what does a bar graph represent, we read the scale so that we know the precise values in the given data.
After reading a bar graph one must be able to draw certain conclusions from it. Drawing some conclusions from given bar graph means interpretations of the bar graph.
Construction of Bar Graphs:
Step I: On a graph paper, we draw-horizontal line (x-axis) and a vertical line y-axis.
Step II: Mark points at equal intervals along horizontal line, below these points write the names of the data items whose values are to be plotted.
Step III: Choose the suitable scale. On the scale determine the height of the bars for the numerical values.
Step IV: Mark these heights parallel to the y-axis from the points taken in Step II.
Step V: On the horizontal line, draw bars of equal width for the heights marked in step IV.
Solved Examples on Bar Graph:
1. Observe the bar graph given below and answer the questions that follow.

Answer the following questions.
(i) How many students have read less than 11 books?
(ii) How many students have read 15 - 20 books?
(iii) How many students have read 25 - 30 books?
(iv) How many students have read more than 15 books?
Solution:
The above graph is showing a relationship between number of students are the books read. Here we find that the interval chosen on the x-axis are 1 - 5, 6 - 10, 11 - 15, 15 - 20 and 25 - 30.
(i) The two bars on the x-axis(1 - 5, 6 - 10) show the number of students who have read books less than 11. The numbers on the y-axis show: 10 + 8 = 18.
(ii) The number on the y-axis corresponding to the bar 15 - 20 shows 11 students.
(iii) The number on the y-axis corresponding to the bar 25 - 30 shows 3 students.
(iv) The two bars on the y-axis show the number of students who have read books more than 15 books. The numbers on the y-axis show: 11 + 3 = 14.
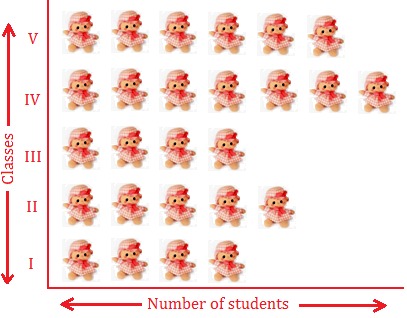
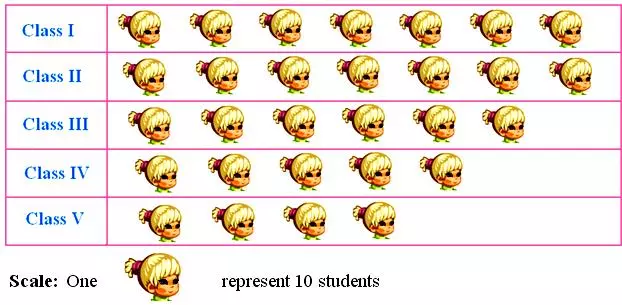
2. The following graph shows the number of students in each class of a school Study the graph and answer the questions that follow:

(i) How many students are there in class I?
(ii) How many more students are there in class IV than in class III?
(iii) Which class has the maximum number of students?
(iv) What is the difference between the maximum and the minimum number of students?
Solution:
(i) Number of students in class I is 20.
(ii) Number of students in class IV more than that in Class III = 100 - 80 = 20
(iii) Class IV has maximum number of students.
(iv) Class IV has the maximum number of students, i.e., 100, and Class I has the minimum number of students, i.e., 20.
So, the difference between these two = 100 - 20 = 80.
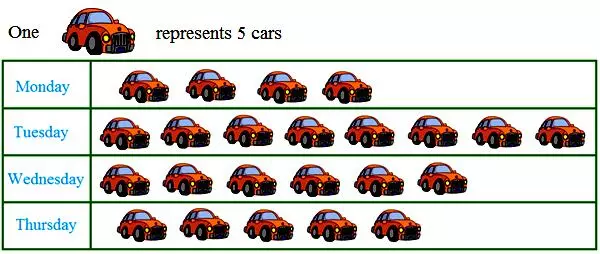
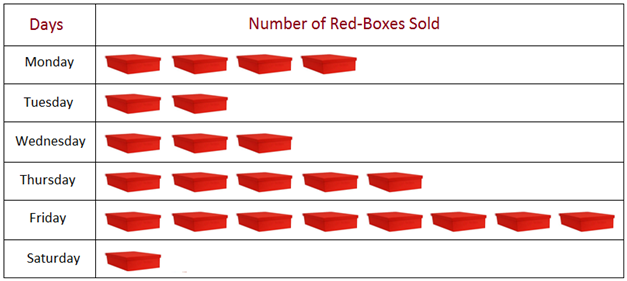
3. Read the given bar graph which shows sale of trousers in a ready-made shop and answer the following questions:

(i) What information is given by the bar graph?
(ii) Mention the scale chosen on the horizontal line representing number of trousers.
(iii) Mention the day of maximum sale.
(iv) Mention the day of minimum sale.
(v) How many trousers sold on Wednesday was the same number of trousers sold on Saturday?
Solution:
(i) The given bar graph shows the sale of trousers in a ready made garments shop from Monday to Saturday.
(ii) The scale chosen is 1 unit = 5 trousers.
(iii) On Friday, maximum number of trousers were sold.
(iv) On Monday, minimum number of trousers were sold.
(v) On Wednesday, 40 trousers were sold, Yes, on Saturday same number of trousers were sold.
Worksheet on Bar Graph:
1. Choose the right answer.
(i) If one block in a bar graph represents 5 students, how many blocks will represent 20 students?
(a) 2 (b) 3 (c) 4 (d) 5
(ii) The representation of data in the form of pictures is a:
(a) Data Handling (b) Tally Mark (c) Bar Graph (d) Pictograph
(iii) All bars in a bar graph have equal:
(a) Size (b) Width (c) Length (d) Axis
Answers:
1. (i) (c) 4
(ii) (d) Pictograph
(iii) (b) Width
2. Choose the right answer and fill in the blank.
(i) __________ can be represented by both words and numbers.
(a) Data (b) Tally Mark (c) Data Handling (d) Pictograph
Answer:
2. (a) Data
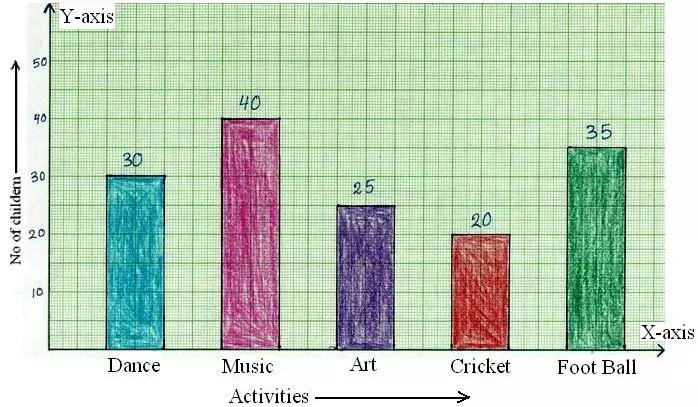
3. Look at the bar graph given below and answer the questions.

(i) Which sport is liked by maximum students?
(a) Cricket
(b) Badminton
(c) Chess
(d) Football
Answer: (b) Badminton
(ii) Which sport is liked by minimum students?
(a) Cricket
(b) Badminton
(c) Chess
(d) Football
Answer: (c) Chess
(iii) Which sport is liked by equal number of students?
(a) Cricket and Chess
(b) Cricket and Football
(c) Badminton and Football
(d) None of these
Answer: (b) Cricket and Football
(iv) How many students like Chess?
(a) 3
(b) 4
(c) 6
(d) 10
Answer: (d) 10
(v) How many students like Cricket?
(a) 10
(b) 15
(c) 20
(d) 25
Answer: (b) 15
(vi) Which sport is liked by 10 students?
(a) Cricket
(b) Badminton
(c) Chess
(d) Football
Answer: (c) Chess
4. Number of girl students in 5 different classes of a school is given below. Read the data and represent it through a Bar Graph.
Classes
I
II
III
IV
V
Number of Girls
75
125
100
200
225

5. A survey of 36 students of a class was done to find out the mode of transport used by them while commuting to their school. the collected data is shown in the table given below. Represent the data in the form of a bar graph.
Mode of Transport
Cycle
School Bus
Walking
Car
No. of Students
6
16
10
4
Now answer the given questions:
(i) Give a suitable title for the graph.
(ii) How many students come by car?
(iii) Which mode of transport is used by most of the students?
(iv) How many students do not travel by car?
Answers:
(ii) 4
(iii) School Bus
(iv) 32
6. Given below is the data showing the number of hours spent by the students in watching television. Draw a Bar Graph for the given information.
Hours
0 - 2
3 - 5
6 - 8
9 - 11
Number of Students
12
16
8
4
5. The students in a school are sending Thank You cards to the soldiers at the border. Observe the graph given below.

Now answer the given questions:
(i) How many students have made less than 51 cards?
(ii) How many students have made 76 - 100 cards?
(iii) Which interval has the maximum number of students?
(iv) How many students have made more than 75 cards?
(v) How many people would you like to Thank?
Answers:
(i) 35
(ii) 15
(iii) 26 - 50
(iv) 20
6. Given below is the date showing the age of students participating in 'Poster making Competition' in school. Draw a bar graph for the given information.

(i) maximum number of pets are dog.
(ii) Only one parrot.
(iii) Six times parrot are cats.
(iv) Two less than cats are rabbits.
(v) Double the rabbits are goats.
(vi) One less than rabbits are tortoise.
Answer:

7. Given below is the date showing the age of students participating in 'Poster making Competition' in school. Draw a bar graph for the given information.
Age (in Years)
5 - 8
9 - 11
12 - 15
15 - 18
Number of Students
90
75
150
170
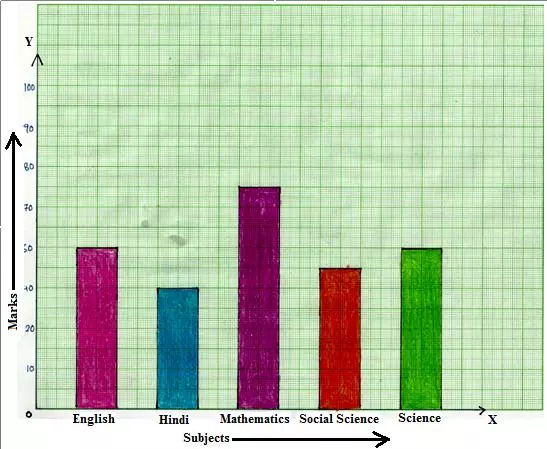
8. The data from the table has been used for making a bar graph to show Alexander's marks in the different subjects in a test. The maximum marks for each subject are 20.
|
Subjects |
Marks | ||
|
Maths English Hindi EVS Painting |
18 16 15 13 20 |

Similar to a pictograph, a bar graph helps us to compare the information and understand it in the right manner.
Looking at the above bar graph we can say that
● Alexander got maximum marks in Painting.
● He got the minimum marks in EVS.
● He got the second highest position in Maths.
Note: Every bar graph must have a title explaining the information given in the graph and the label explaining the scales.
You might like these
Construction of Bar Graphs | Examples on Construction of Column Graph
Now we will discuss about the construction of bar graphs or column graph. In brief let us recall about, what is bar graph? Bar graph is the simplest way to represent a data. In consists of rectangular bars of equal width. The space between the two consecutive bars must be
Interpreting Bar Graph | How to Read a Bar Graph? |Reading a Bar Graph
We will learn interpreting bar graph collecting the given information. Now let us interpret a bar graph. Observe the following bar graph representing the number of students wearing different
Worksheet on Pictographs | Picture Graph Worksheets | Pictograph Works
In worksheet on pictographs, all grade students can practice the questions on data handling. We can present the given information in many ways. In pictograph the information is presented by using a picture as symbol. A pictograph has a title and a key.
Pictorial Representation |Pictograph Worksheet |Representation of Data
Some basic ideas of pictorial representation or pictograph, often related types of symbols or pictures are used to represent a specific number of objects.
2nd Grade Data Handling | Collection of Objects |Information Collected
We have learnt, that a collection of objects can be stored out based on their color, shape, size or any other common thing among them. We can organise all the information in a table to understand how many of each item is there in a collection. Information collected is called
Worksheet on Bar Graphs | Bar Graphs or Column Graphs | Graphing Bar
In math worksheet on bar graphs students can practice the questions on how to make and read bar graphs or column graphs. Test your knowledge by practicing this graphing worksheet where we will
Worksheet on Data Handling | Questions on Handling Data |Grouping Data
In math practice worksheet on data handling we will solve numerous types of questions on handling data, frequency distribution and on grouping data. Questions on frequency distribution
Data Handling | Data Analysis | Data Processing | Numerical Data | Def
In data handling we will learn how to do data analysis or data processing while handling data in mathematics. What is data handling in math? In various fields, we need information
Pictographs | Pictorial Representation | Pictorial Symbols | Symbols
In pictographs we learnt to recognize different things in our surroundings and to express the given information through pictorial symbols of different objects.
Worksheet on Pie Chart | Questions on Pie Graphs | Creating Pie Chart
In math worksheet on pie chart students can practice different types of questions on pie graphs. From the given data we need to calculate the central angle of the components to construct the questions
Construction of Pie Chart | Steps of Construction | Solved Examples
The pie chart is a pictorial representation of data relative to a whole. Each portion in the circle represent an element of the collected data. The pie chart represents the composition of various elements in a whole. The total value of the pie chart is always 100%.
Interpreting a Pictograph | Information Regarding the Pictograph |Math
In interpreting a pictograph, we get a lot of information regarding the pictograph items. The following examples may illustrate the interpretation of pictographs.
Pictograph to Represent The Collected Data | Forming Pictograph | Math
Pictures or symbols are made in a pictograph to represent the collected data. So, we can say that a pictograph represents the data and gives information quickly and clearly.
Examples of Pictographs |Pictorial Representation|Pictograph Questions
Some sample examples of pictographs or pictorial representation are shown, how the objects are used to give information regarding mathematical data. Read the pictograph and gather the information


Didn't find what you were looking for? Or want to know more information about Math Only Math. Use this Google Search to find what you need.

Recent Articles
-
Successor and Predecessor | Successor of a Whole Number | Predecessor
Jul 29, 25 12:59 AM
 The number that comes just before a number is called the predecessor. So, the predecessor of a given number is 1 less than the given number. Successor of a given number is 1 more than the given number…
 -
Worksheet on Area, Perimeter and Volume | Square, Rectangle, Cube,Cubo
Jul 28, 25 01:52 PM
 In this worksheet on area perimeter and volume you will get different types of questions on find the perimeter of a rectangle, find the perimeter of a square, find the area of a rectangle, find the ar…
 -
Worksheet on Volume of a Cube and Cuboid |The Volume of a RectangleBox
Jul 25, 25 03:15 AM
 We will practice the questions given in the worksheet on volume of a cube and cuboid. We know the volume of an object is the amount of space occupied by the object.1. Fill in the blanks:
 -
Volume of a Cuboid | Volume of Cuboid Formula | How to Find the Volume
Jul 24, 25 03:46 PM
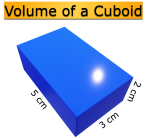 Cuboid is a solid box whose every surface is a rectangle of same area or different areas. A cuboid will have a length, breadth and height. Hence we can conclude that volume is 3 dimensional. To measur…
 -
Volume of a Cube | How to Calculate the Volume of a Cube? | Examples
Jul 23, 25 11:37 AM
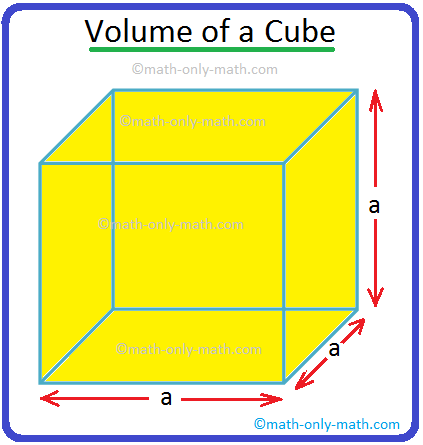 A cube is a solid box whose every surface is a square of same area. Take an empty box with open top in the shape of a cube whose each edge is 2 cm. Now fit cubes of edges 1 cm in it. From the figure i…
New! Comments
Have your say about what you just read! Leave me a comment in the box below. Ask a Question or Answer a Question.