Worksheet on Bar Graphs
In math worksheet on bar graphs students can practice the questions on how to make and read bar graphs or column graphs. Test your knowledge by practicing this graphing worksheet where we will find some of the numerical data is given to us and then we need to represent it by a bar chart on a graph paper. Here, the questions are mainly based on charts and graphs worksheets where the information is given according to the question.
1. The marks of a student in different subjects are given below:
| Subject | French | English | Math | Science | Social |
|---|---|---|---|---|---|
| Marks |
Draw a bar graph from the above information.
2. The below table shows the favorites games of 250 students of a school.
| Games | Swimming | Badminton | Football | Tennis | Cricket |
|---|---|---|---|---|---|
| No. of student |
Represent the above data by a bar graph.
3. The following table shows the year wise strength of a dancing school.
| Year | 2006-07 | 2007-08 | 2008-09 | 2009-10 | 2010-11 |
|---|---|---|---|---|---|
| No. of Students |
Represent the above data by a bar graph.
4. The following table shows the number of scooter produced by a company during six consecutive years.
| Year | 2001 | 2002 | 2003 | 2004 | 2005 | 2006 |
|---|---|---|---|---|---|---|
| No. of Scooters |
Draw a bar graph to represent the above data.
5. The birth rate per thousands in five countries over a period of time is shown below:
| Country | China | India | Jermany | UK | Sweden |
|---|---|---|---|---|---|
| Birth rate per thousand |
Represent the above data by a bar graph.
6. The population in lakhs of six Indian states as estimated in 2001 is given below:
| State | Population (in lakhs) |
|---|---|
| Bihar | |
| Jharkhand | |
| Uttar Pradesh | |
| Uttranchal | |
| Madhya Pradesh | |
| Chattisgarh |
Represent the above data by a bar graph.
7. The following data shows India’s total population (in millions) from 1951 to 2001.
| Year of Census | 1951 | 1961 | 1971 | 1981 | 1991 | 2001 |
|---|---|---|---|---|---|---|
| Population (in millions) |
Represent the above data by a bar graph.
8. The following table shows the interest paid by India (in thousand crore rupees) on external debts during the period 1998—99 to 2002—03.
| Year | 1998-99 | 1999-00 | 2000-01 | 2001-02 | 2002-03 |
|---|---|---|---|---|---|
| |
Draw a bar graph to represent the above data.
9. The air distances of four cities from Delhi (in km) are given below:
| City | Kolkata | Mumbai | Chennai | Hyderabad |
|---|---|---|---|---|
| Distance form Delhi (in KM) |
Draw a bar graph to represent the above data.
10. The following table shows the life expectancy (average age to which people live) in various countries in a particular year.
| Country | Japan | India | Britain | Ethiopia | Cambodia |
|---|---|---|---|---|---|
Represent the above data by a bar graph.
11. The following table shows the market position of different types of soaps
| Brands | A | B | C | D | Others |
|---|---|---|---|---|---|
| Percentage of buyer |
Draw a bar graph to represent the above data.
12. Various modes of transport used by 1850 students of a school are given below:
| School Bus | Private Bus | Bicycle | Rickshaw | By Foot |
|---|---|---|---|---|
Draw a bar graph to represent the above data.
13. Look at the bar graph given below:

Read it carefully and answer the following questions.
(i) What information does the bar graph give?
(ii) In which subject is the student very good
(iii) In which subject is he poor?
(iv) What are the average of his marks?
14. A survey was conducted among the students of class IV to find their favorite subject. The collected information is represented in the form of a bar graph. Observe the graph and answer the following questions.

(i) How many students participated in the survey?
(ii) How many students had Mathematics as their favourite subject?
(iii) Which subject was least favourite?
(iv) What is the difference between the number of students who liked Hindi and English?
(v) What is your favourite subject?
(vi) Show the above data in the form of tally marks.
15. In a survey of 85 families of a colony, the number of members in each family was recorded, and the data has been represented by the following bar graph.
Read the bar graph carefully and answer the following questions:
(i) What information does the bar graph give?
(ii) How many families have 3 members?
(iii) How many people live alone?
(iv) Which type of family is the most common? How many members are there in each family of this kind?

16. Observe the graph given below and given a suitable title to it. Complete the given table.

Title: ________________________
|
S.No (i) (ii) (iii) (iv) (v) |
TV Channels Cartoon Network National Geographic Discovery Animal Planet Music Channel |
Number of Students __________ __________ __________ __________ __________ |
Answers for worksheet on bar graph are given below to check the exact answers of the given questions.
Answers:
13. (i) It shows the marks obtained by a student in five subjects
(ii) Mathematics
(iii) HIidi
(iv) 56
14. (i) 20
(ii) 3
(iii) Mathematics
(iv) 1
(v)

15. It gives the number of families containing 2, 3, 4, 5 members each.
(ii) 40
(iii) none
(iv) Family having 3 members, 3 members.
16. (i) 8
(ii) 3
(iii) 5
(iv) 9
(v) 5
● Constructing and Interpreting Bar Graphs or Column Graphs
● Bar Graphs or Column Graphs - Worksheets
Worksheet on Bar Graphs or Column Graphs
From Worksheet on Bar Graphs to HOME PAGE
Didn't find what you were looking for? Or want to know more information about Math Only Math. Use this Google Search to find what you need.


Recent Articles
-
Perpendicular Lines | What are Perpendicular Lines in Geometry?|Symbol
Apr 19, 24 02:46 AM
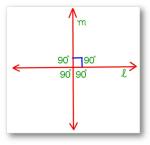 In perpendicular lines when two intersecting lines a and b are said to be perpendicular to each other if one of the angles formed by them is a right angle. In other words, Set Square Set Square If two…
 -
Fundamental Geometrical Concepts | Point | Line | Properties of Lines
Apr 19, 24 01:55 AM
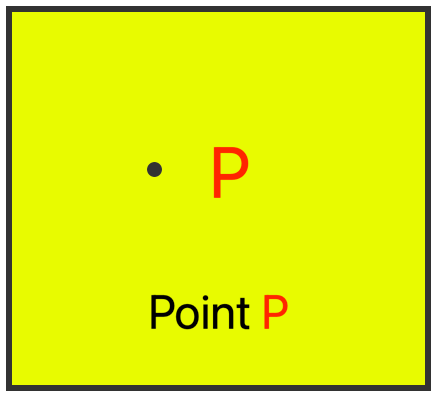 The fundamental geometrical concepts depend on three basic concepts — point, line and plane. The terms cannot be precisely defined. However, the meanings of these terms are explained through examples.
 -
What is a Polygon? | Simple Closed Curve | Triangle | Quadrilateral
Apr 18, 24 02:15 AM
What is a polygon? A simple closed curve made of three or more line-segments is called a polygon. A polygon has at least three line-segments. -
Simple Closed Curves | Types of Closed Curves | Collection of Curves
Apr 18, 24 01:36 AM
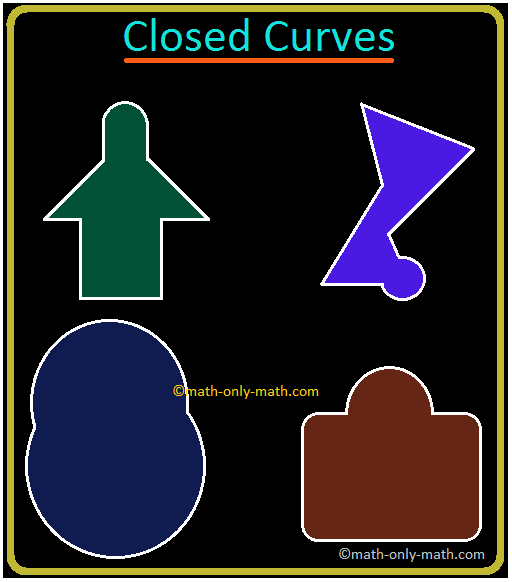 In simple closed curves the shapes are closed by line-segments or by a curved line. Triangle, quadrilateral, circle, etc., are examples of closed curves.
 -
Tangrams Math | Traditional Chinese Geometrical Puzzle | Triangles
Apr 18, 24 12:31 AM
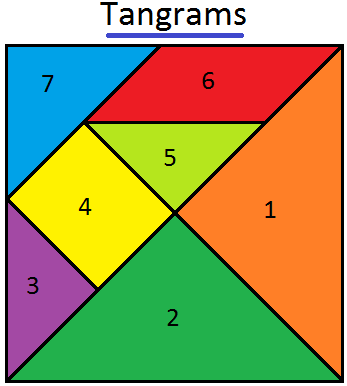 Tangram is a traditional Chinese geometrical puzzle with 7 pieces (1 parallelogram, 1 square and 5 triangles) that can be arranged to match any particular design. In the given figure, it consists of o…