Worksheet on Pie Chart
In math worksheet on pie chart students can practice different types of questions on pie graphs. From the given data we need to calculate the central angle of the components to construct the questions given in worksheet on pie chart.
A. Questions on Creating Pie Chart:
1. Mr. X monthly income is $ 14400. The monthly expenses of his family on various items are given below.
| Item | Rent | Food | Clothing | Education | Savings |
|---|---|---|---|---|---|
Represent the above data by a pie chart.
2. In a Zoological park there are 1000 creatures as per the following table given below:
| Beast Animals | Other Land Animals | Birds | Water Animals | Reptiles |
|---|---|---|---|---|
Represent the above data by a pie chart.
3. Various modes of transport used by 1260 students in a given school are given below:
| School Bus | Private Bus | Bicycle | Rickshaw | On foot |
|---|---|---|---|---|
Represent the above data by a pie chart.
4. The data given below shows number of hours spent by a school boy on different activities on a working day.
| Activity | School | Homework | Play | Sleep | Others | Total |
|---|---|---|---|---|---|---|
Represent the above data by a pie graph.
5. In a company there are 1080 workers of different religions. The data of the different religion are given below:
| Religion | Hindu | Nepali | Islam | Christian |
|---|---|---|---|---|
Draw a pie chart to represent the above data.
6. The marks obtained by Sam in an examination are given below:
| Subject | English | French | Mathematics | Science | Social Science |
|---|---|---|---|---|---|
Represent the above data by a pie chart.
Hint: Total marks obtained = (105 + 75 +150 +120 + 90) = 540.
7. The following table gives the number of different fruits kept in a hamper.
| Type of Fruit | Mangoes | Apples | Oranges | Coconuts | Pomegranates |
|---|---|---|---|---|---|
Represent the above data by a pie chart.
Hint: Total number of fruits = 90
Worksheet on Pie Chart
8. The following data shows the agricultural production in India during a certain year.
| Foodgrain | Rice | Wheat | Coarse Cereals | Pulses |
|---|---|---|---|---|
Draw a pie chart to represent the above data.
Hint: Total production (57 + 76 + 38 + 19) million tonnes = 190 million tonnes.
9. Given below is the result of an annual examination of a class, showing the percentage of students in each category.
| First Division | Second Division | Third Division | Failed |
|---|---|---|---|
Represent the above data by a pie chart.
10. The following table shows the percentage of buyers of four different brands of bathing soaps.
| Brand | A | B | C | D |
|---|---|---|---|---|
Represent the above data by a pie chart.
B. Tick (✔) the correct answer in each of the following:
1. Mr. Bond's monthly income is $ 2400 and his monthly expenditure on rent is $ 250. The central angle of the sector representing rent expenses in the pie chart would be …………… .
(a) 30°
(b) 37 ¹/₂°
(c) 45°
(d) 60°
2. If 35% of the people residing in a locality are Sikhs then the central angle of the sector representing the Sikh community in the pie chart would be
(a) 108°
(b) 115°
(c) 126°
(d) 135°
3. If in the pie chart representing the number of students opting for different streams of study out of a total strength of 1650 students, the central angle of the sector representing Arts students is 48°, what is the number of students who opted for Arts stream?
(a) 220
(b) 240
(c) 275
(d) 320
4. In the pie chart representing the percentages of students having interest in reading various kinds of books, the central angle of the sector representing students reading novels is 8l° What is the percentage of students interested in reading novels?
(a) 15 %
(b) 18 %
(c) 22 ¹/₂°
(d) 27 ¹/₂°
Answers for the worksheet on pie chart are given below to check the exact answer.
Answers:
B. 1. (b)
2. (c)
3. (a)
4. (c)
● Pie Charts or Pie Graphs
● Pie Charts or Pie Graphs - Worksheets
8th Grade Math Practice
From Worksheet on Pie Chart to HOME PAGE
Didn't find what you were looking for? Or want to know more information about Math Only Math. Use this Google Search to find what you need.


Recent Articles
-
Fundamental Geometrical Concepts | Point | Line | Properties of Lines
Apr 19, 24 01:50 PM
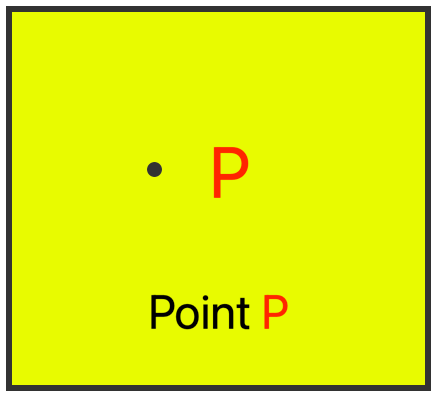 The fundamental geometrical concepts depend on three basic concepts — point, line and plane. The terms cannot be precisely defined. However, the meanings of these terms are explained through examples.
 -
What is a Polygon? | Simple Closed Curve | Triangle | Quadrilateral
Apr 19, 24 01:22 PM
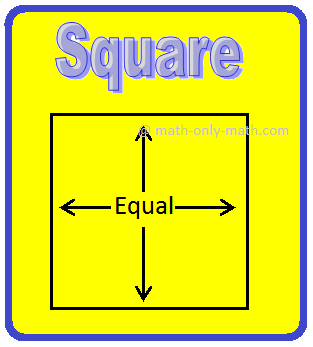 What is a polygon? A simple closed curve made of three or more line-segments is called a polygon. A polygon has at least three line-segments.
 -
Perpendicular Lines | What are Perpendicular Lines in Geometry?|Symbol
Apr 19, 24 02:46 AM
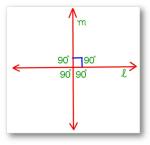 In perpendicular lines when two intersecting lines a and b are said to be perpendicular to each other if one of the angles formed by them is a right angle. In other words, Set Square Set Square If two…
 -
Simple Closed Curves | Types of Closed Curves | Collection of Curves
Apr 18, 24 01:36 AM
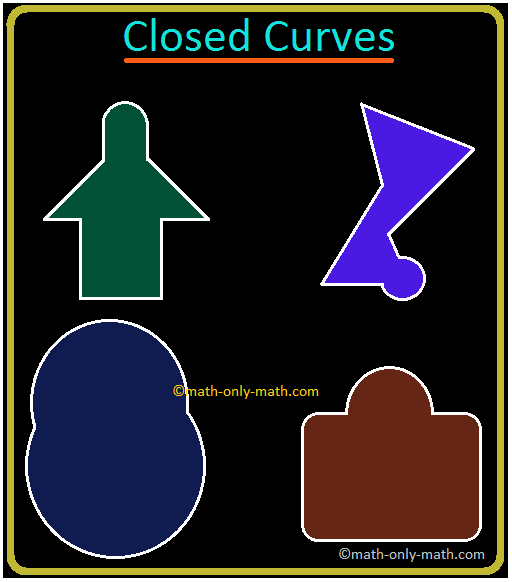 In simple closed curves the shapes are closed by line-segments or by a curved line. Triangle, quadrilateral, circle, etc., are examples of closed curves.
 -
Tangrams Math | Traditional Chinese Geometrical Puzzle | Triangles
Apr 18, 24 12:31 AM
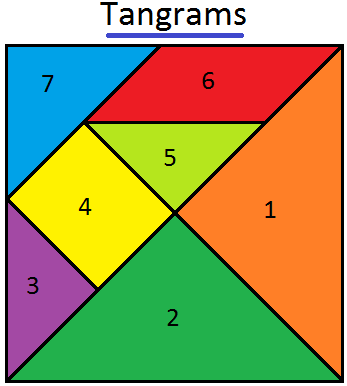 Tangram is a traditional Chinese geometrical puzzle with 7 pieces (1 parallelogram, 1 square and 5 triangles) that can be arranged to match any particular design. In the given figure, it consists of o…