Pictographs
In pictographs we learn to recognize different things in our surroundings and to express the given information through pictorial symbols of different objects.
Every government, business organization, department or individual needs some information to review the progress, plans and activities for the future. Even your school principal needs different information to plan for the next session.
For example, he/she wants to purchase new furniture for the next session. Naturally, he/she will need information about number of classes, number of students in each class, number of furniture items present, number of new admissions expected, and so on. Such information is always collected in numbers, called numerical data.
The collection of information through numerical data is done by many ways such as going individually from place to place and gathering information, collecting information through newspapers, magazines and T.V. etc. or going to a library and consulting reference books, government publications etc.
To study the details of data, we use pictures. The study of data through pictures is known as pictorial representation of data.
There are different methods of representing numerical data
pictorially. One of the methods is to use picture symbols. Such a
representation is called a pictograph. Now we will study about representing information by pictographs in more details.
What is pictorial representation or pictograph?
The expression or illustration regarding the different information about any object or objects or activities through pictures or picture symbols is called pictorial representation or pictograph.
A pictograph is a way of showing data using images. Each image stands for a certain number of things. Pictograph makes information easy and clear to understand.
We can collect data regarding conveyances of students coming and going to school from their homes. The pictograph can be made using symbols of conveyances, students and their numbers.Pictograph showing conveyance and students

The given pictograph expresses the following information:
(i) The kinds of conveyance used by the students.
(ii) The number of students using conveyances and the number of students coming and going on foot.
(iii) The number of students using school-bus, own car, bicycle, rickshaw, taxi, etc.
(iv)
Percentage of students using hired tempo or rickshaw, own car or
scooter, cycle etc., fraction of students coming and going without any
vehicle.
(v) Percentage of students related to rich family. Students having their own cars belong to rich families.
Thus, much information may be gathered by studying the pictograph.
Let us consider some examples on Pictograph Representation:
1. Ryan, the student of a primary school, collects some information about the number of studying in different class from call I to V.

Represent the data through a pictograph.
Solution:
Suppose the symbol of one figure represents 10 students as shown below.
Now we can easily represent the information given in the table with the help of the symbol. We can represent the number of students horizontally and the classes vertically

The pictograph gives us the following information.
(i) The pictograph shows the number of students in classes I to V.
(ii) The number of students is maximum in class IV.
(iii) The number of students is minimum in classes I to III.
(iv) The number of students is same in class I to III.
(v) The total number of students in the school is 260.
2. Students of grade III-A come to school by different mode of transport. Some of them come by school bus, some by private van and others by personal vehicle.
Let us observe the table given here showing number of students and mode of transportation.
|
Mode of Transportation |
Number of Students |
|
School Bus |
10 |
|
Private Van |
4 |
|
Walking |
5 |
|
Cycle |
2 |
|
Car |
6 |
|
Scooter |
8 |
Let us represent the given information using an image to draw a pictograph and give a title for the same.
Number of students use different mode of transportation

This representation of data where we use pictures or symbols is known as pictograph or pictogram. A pictograph has a title and a key. Here, ‘Number of students use different mode of transportation’ is a title or a label. The symbols used in a pictograph are well defined.
 |
is a symbol that is used here to represent a student. It is also called a key of the pictograph. |
Here, in the above example,
|
|
represents 1 student. |
|
So, the key of the pictograph is |
|
=
1 student. |
When the numbers in data are large we can use one picture or symbol to represent a specific number.
Pictographs present numerical data through appropriate pictures.
To draw a graph we have to select an appropriate scale.
3. The following table gives the number of buckets sold by a shop in each month of the year 2015.
|
Month January February March April May June July August September October November December |
Number of Buckets 30 40 20 60 40 50 50 70 40 80 100 90 |
Number of buckets sold by a shop in the year 2015.
|
Scale |
|
= 10 buckets |
Number of Buckets Sold in each Month of 2015
|
January |
30 ÷ 10 = 3 |
|
|
February |
40 ÷ 10 = 4 |
|
|
March |
20 ÷ 10 = 2 |
|
|
April |
60 ÷ 10 = 6 |
|
|
May |
40 ÷ 10 = 4 |
|
|
June |
50 ÷ 10 = 5 |
|
|
July |
50 ÷ 10 = 5 |
|
|
August |
70 ÷ 10 = 7 |
|
|
September |
40 ÷ 10 = 4 |
|
|
October |
80 ÷ 10 = 8 |
|
|
November |
100 ÷ 10 = 10 |
|
|
December |
90 ÷ 10 = 9 |
|
Study the pictograph carefully and answer the following questions.
(i) In which month was the maximum number of buckets sold?
November
(ii) In which month was the minimum number of buckets sold?
March
(iii) What is the total number of buckets sold in the whole year?
67
(iv) What is the total number of buckets sold in the month of June and August?
12
4. The number of a few items sold by a shop in the month of July is given below:
Soap = 800 Fan = 600
Bulb = 700 Match box = 900
Represent it by a pictograph.


Guidelines for drawing a pictograph.
- Give a title for the pictograph
- A suitable scale should be chosen according to the size of the paper.
- Diagrams should be drawn neatly.
Questions and Answers on Pictographs:
1. Fill in the blanks:
(i) The method of representing data using pictures is called .............
(ii) A pictograph has a title and a .............
Answer:
1. (i) Pictograph
(ii) key
2.
How many paintings did the painter sell in February?
 |
= 1 painting |

Answer:
2. 5 paintings.
3. The following pictograph shows the different means of transport used by the families of a colony. Each picture represents 10 families. Study the pictograph and answer the following questions.

(i) How many families use scooter?
(ii) How many families use motorbike?
(iii) Which is the means of transport used by maximum number of families?
(iv) How many families use van?
4. The following table gives the number of students who have opted for music, dance, drawing and craft in a school.
Music – 400 Dance – 300
Drawing – 500 Craft – 300
Represent the information on a pictograph.
5. The number of animals in a zoo are given below.
Lions – 20 Snakes – 35 Deer – 10
Monkeys – 50 Tigers – 25. Rabbits – 45
Represent the information on a pictograph.
6. The following pictograph shows the classwise number of students coming to school by bicycle. Study it and answer the following questions.
|
Scale |
|
= 2 studnts |
The Classwise Number of Students Coming to School by Bicycle.

(i) How many students come to school by bicycle in class X?
(ii) Which class has the highest number of students coming to school by bicycle?
(iii) Which class has the least number of students coming to school by bicycle?
(iv) In all, how many students come to school by bicycle?
Related Concepts on Data Handling
● Pictograph to Represent The Collected Data
4th Grade Math Activities
From Pictographs to HOME PAGE
Didn't find what you were looking for? Or want to know more information about Math Only Math. Use this Google Search to find what you need.


Recent Articles
-
Perimeter of a Rectangle | How to Find the Perimeter of a Rectangle?
Apr 25, 24 02:01 PM
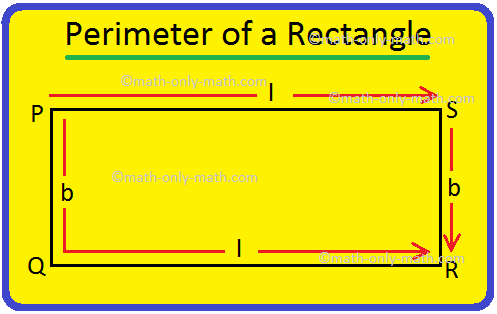 We will discuss here how to find the perimeter of a rectangle. We know perimeter of a rectangle is the total length (distance) of the boundary of a rectangle. ABCD is a rectangle. We know that the opp…
 -
Perimeter of a Square | How to Find the Perimeter of Square? |Examples
Apr 25, 24 12:54 PM
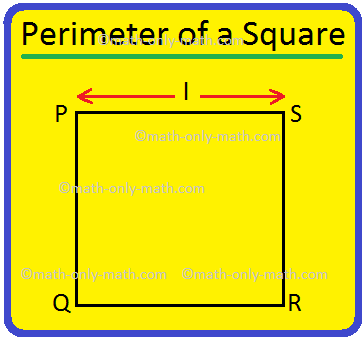 We will discuss here how to find the perimeter of a square. Perimeter of a square is the total length (distance) of the boundary of a square. We know that all the sides of a square are equal. Perimete…
 -
Perimeter of a Triangle | Perimeter of a Triangle Formula | Examples
Apr 25, 24 12:53 PM
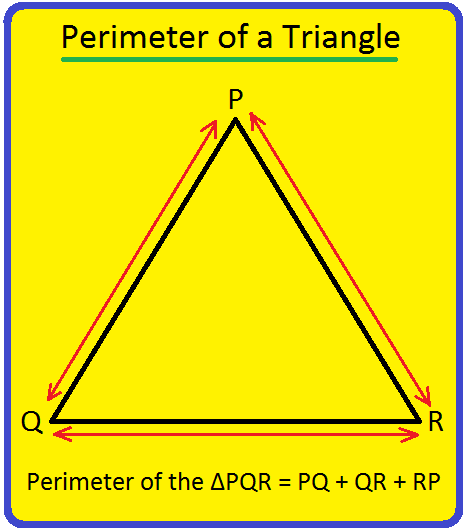 We will discuss here how to find the perimeter of a triangle. We know perimeter of a triangle is the total length (distance) of the boundary of a triangle. Perimeter of a triangle is the sum of length…
 -
Dividing 3-Digit by 1-Digit Number | Long Division |Worksheet Answer
Apr 24, 24 03:46 PM
 Dividing 3-Digit by 1-Digit Numbers are discussed here step-by-step. How to divide 3-digit numbers by single-digit numbers? Let us follow the examples to learn to divide 3-digit number by one-digit nu…
 -
Symmetrical Shapes | One, Two, Three, Four & Many-line Symmetry
Apr 24, 24 03:45 PM
 Symmetrical shapes are discussed here in this topic. Any object or shape which can be cut in two equal halves in such a way that both the parts are exactly the same is called symmetrical. The line whi…