Subscribe to our ▶️ YouTube channel 🔴 for the latest videos, updates, and tips.
Home | About Us | Contact Us | Privacy | Math Blog
Condition of Perpendicularity
We will discuss here about the condition of perpendicularity of two straight lines.
Let the lines AB and CD be perpendicular to each other. If the inclination of AB with the positive direction of the x-axis is θ then the inclination of CD with the positive direction of the x-axis will be 90° + θ.
Therefore, the slope of AB = tan θ, and
the slope of CD = tan (90° + θ).
From trigonometry, we have, tan (90° + θ) = - cot θ
Therefore, if the slope of AB is m1 and
the slope CD = m2 then
m1 = tan θ and m2 = - cot θ.
So, m1 ∙ m2 = tan θ ∙ (- cot θ) = -1
Two lines with slopes m1 and m2 are perpendicular to each other if and only if m1 ∙ m2 = -1
Note: (i) By the definition, the x-axis is perpendicular to the
y-axis.
(ii) By definition, any line parallel to the x-axis is perpendicular to any line parallel to the y-axis.
(iii) If the slope of a line is m then any line perpendicular to it will have the slope −1m (i.e., negative reciprocal of m).
Solved example on Condition of perpendicularity of two lines:
Find the equation of the line passing through the point (-2, 0) and perpendicular to the line 4x – 3y = 2.
Solution:
First we need to express the given equation in the form y = mx + c.
Given equation is 4x – 3y = 2.
-3y = -4x + 2
y = 43x - 23
Therefore, the slope (m) of the given line = 43
Let the slope of the required line be m1.
According to the problem the required line is perpendicular to the given line.
Therefore, from the condition of perpendicularity we get,
m1 ∙ 43 = -1
⟹ m1 = -34
Thus, the required line has the slope -34 and it passes through the point (-2, 0).
Therefore, using the point-slope form we get
y - 0 = -34{x - (-2)}
⟹ y = -34(x + 2)
⟹ 4y = -3(x + 2)
⟹ 4y = -3x + 6
⟹ 3x + 4y + 6 = 0, which is the required equation.
● Equation of a Straight Line
- Inclination of a Line
- Slope of a Line
- Intercepts Made by a Straight Line on Axes
- Slope of the Line Joining Two Points
- Equation of a Straight Line
- Point-slope Form of a Line
- Two-point Form of a Line
- Equally Inclined Lines
- Slope and Y-intercept of a Line
- Condition of Perpendicularity of Two Straight Lines
- Condition of parallelism
- Problems on Condition of Perpendicularity
- Worksheet on Slope and Intercepts
- Worksheet on Slope Intercept Form
- Worksheet on Two-point Form
- Worksheet on Point-slope Form
- Worksheet on Collinearity of 3 Points
- Worksheet on Equation of a Straight Line
From Condition of Perpendicularity of Two Straight Lines to HOME
Didn't find what you were looking for? Or want to know more information about Math Only Math. Use this Google Search to find what you need.

Recent Articles
-
5th Grade Pie Chart | Definition of Pie Chart | Construction |Examples
Jul 31, 25 05:12 PM
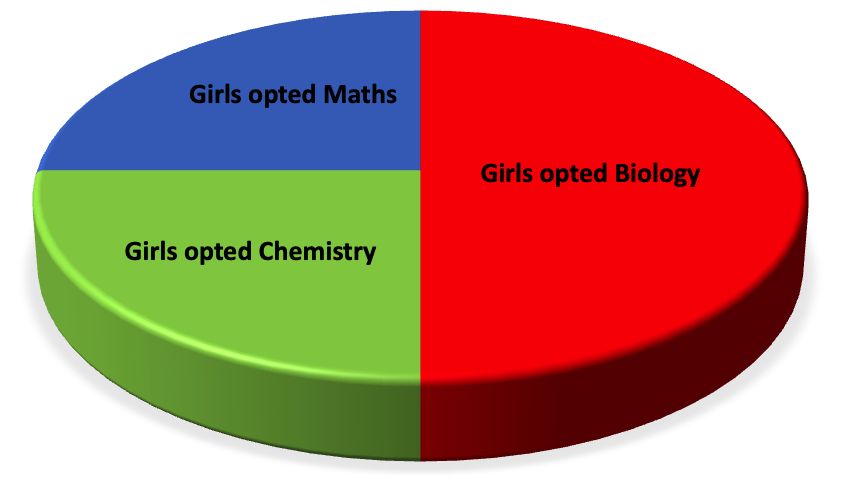 Data can also be represented in a circle. This method, to represent data, is called a pie chart. Let us understand this method with the help of an example.
 -
Frequency Distribution |Tally Marks |Frequency Distribution Table
Jul 31, 25 12:23 PM
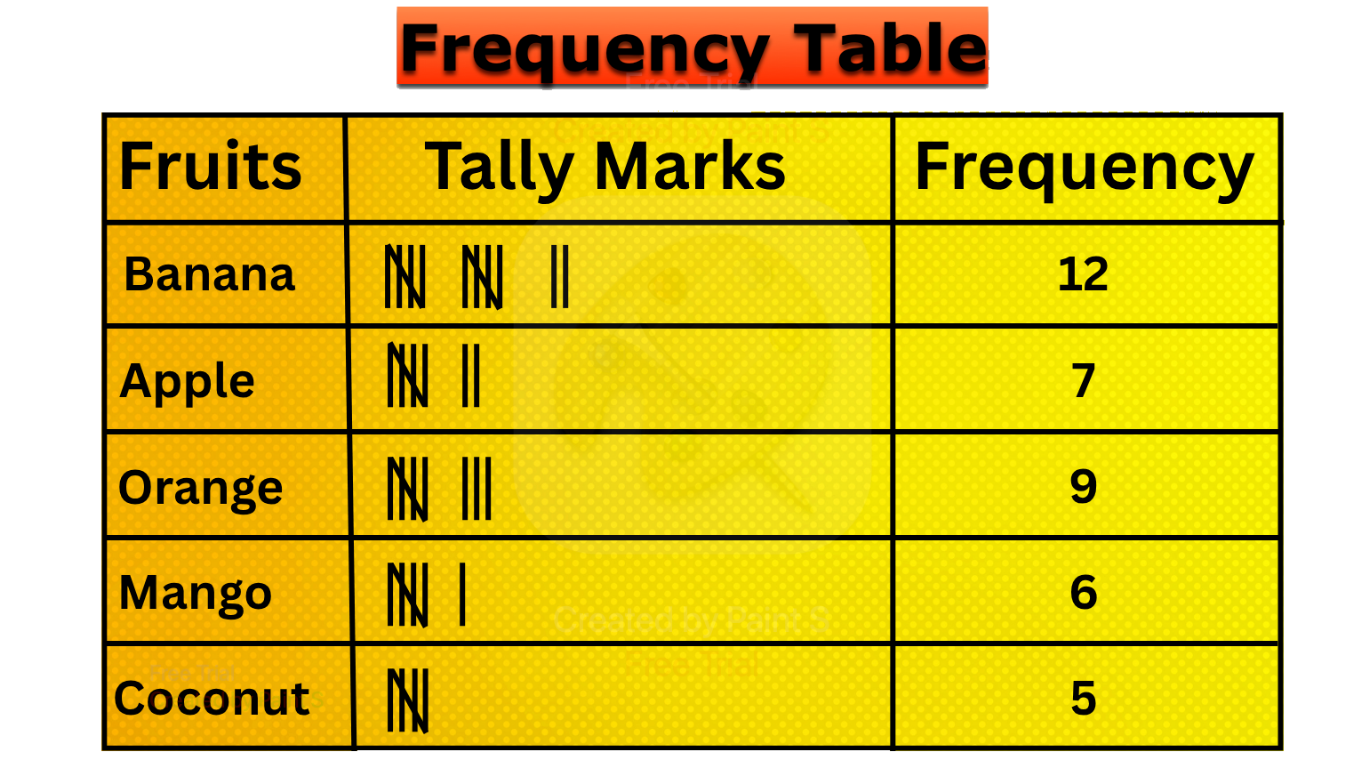 What is frequency distribution?The number of times a particular observation occurs in a given data is called its frequency. In 7ᵗʰ grade and 8ᵗʰ grade frequency distribution,
 -
5th Grade Bar Graph | Definition | Interpret Bar Graphs|Free Worksheet
Jul 31, 25 05:16 AM
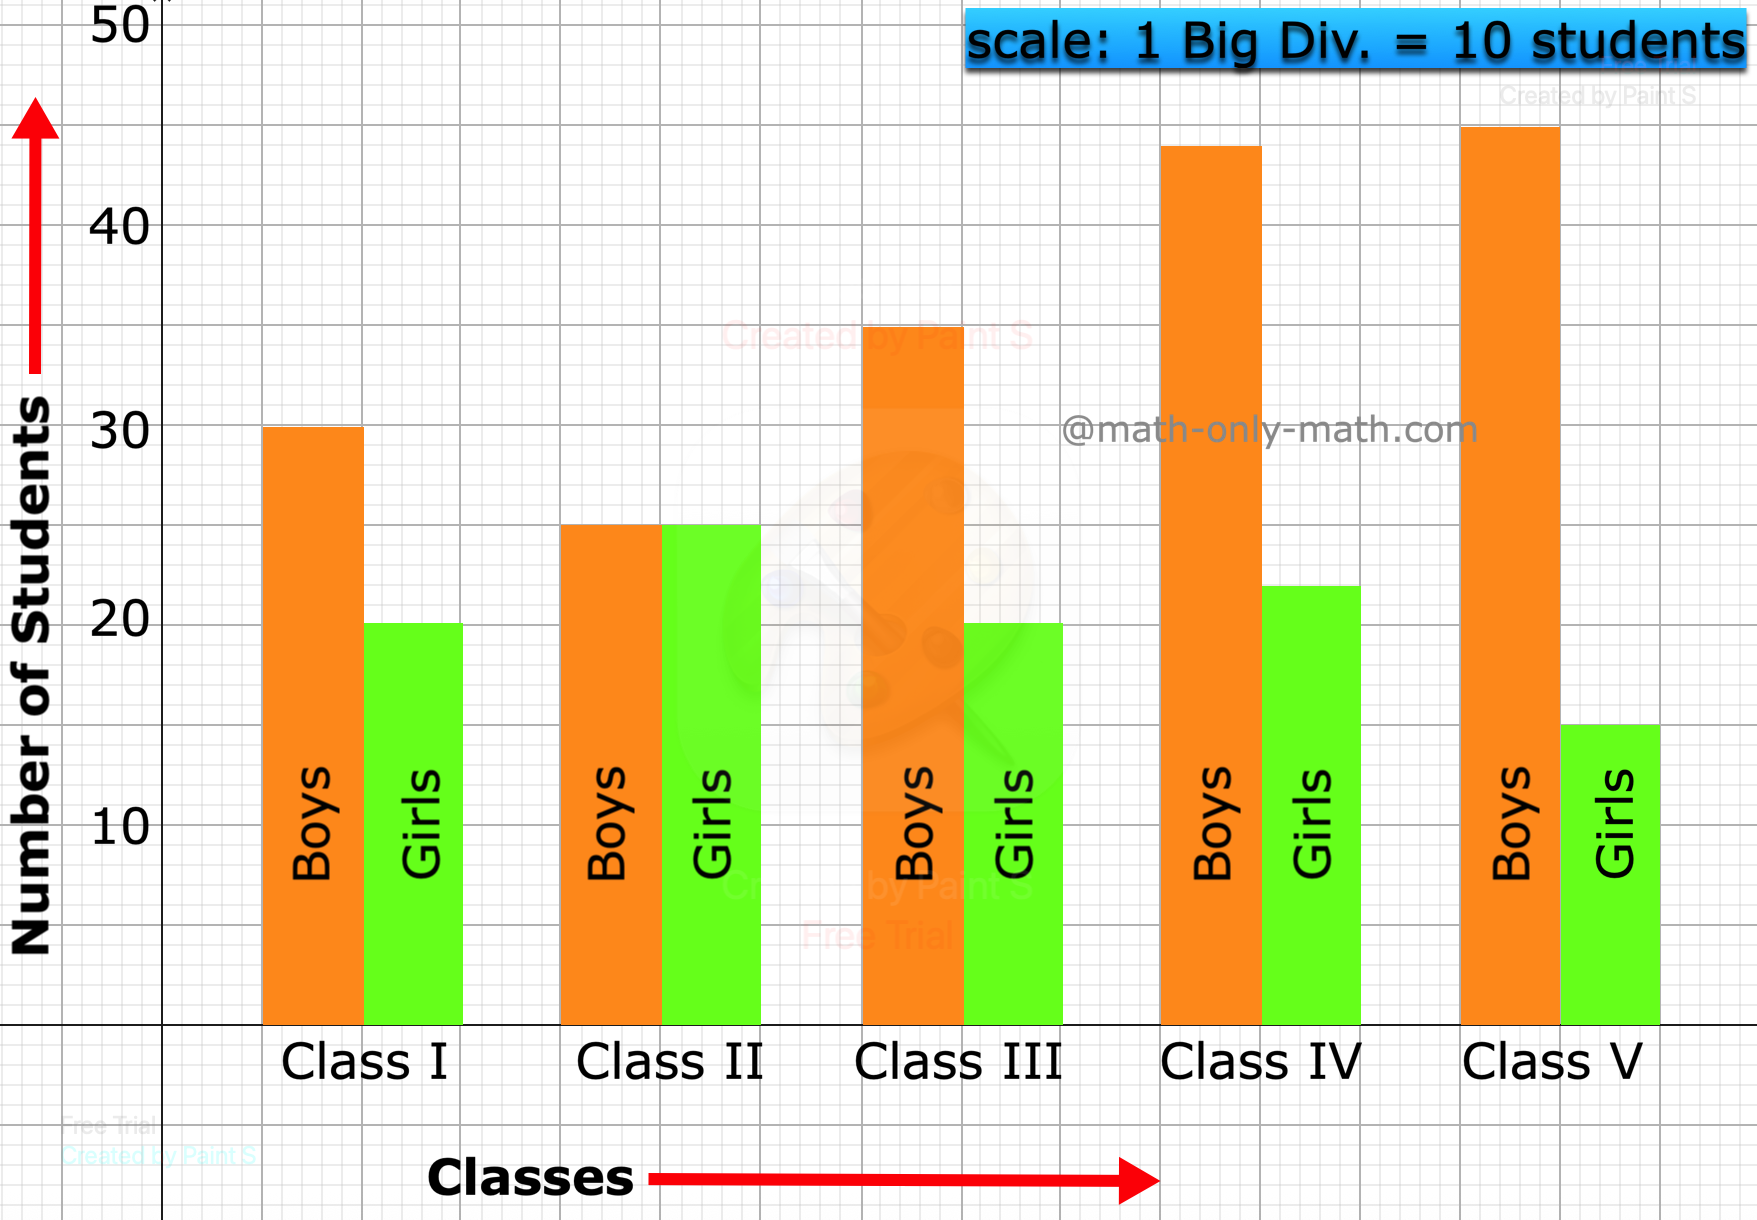 We learn how to represent the data on the bar graph. Data can be represented by bars (like rectangle) whose lengths represent numerical values. One can use horizontal or vertical bars. Instead of rect…
 -
Construction of Bar Graphs | Examples on Construction of Column Graph
Jul 31, 25 03:35 AM
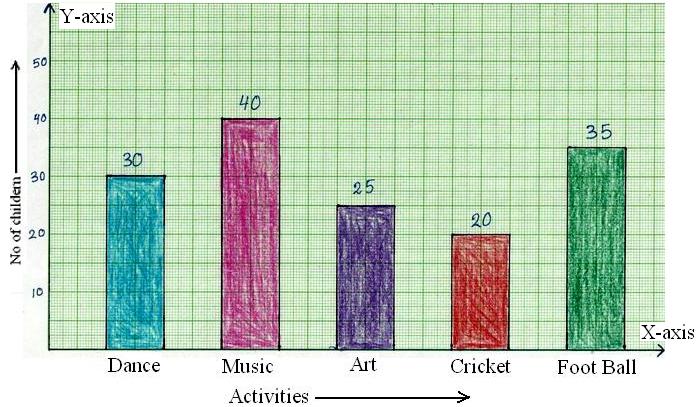 Now we will discuss about the construction of bar graphs or column graph. In brief let us recall about, what is bar graph? Bar graph is the simplest way to represent a data. In consists of rectangular…
 -
Successor and Predecessor | Successor of a Whole Number | Predecessor
Jul 29, 25 12:59 AM
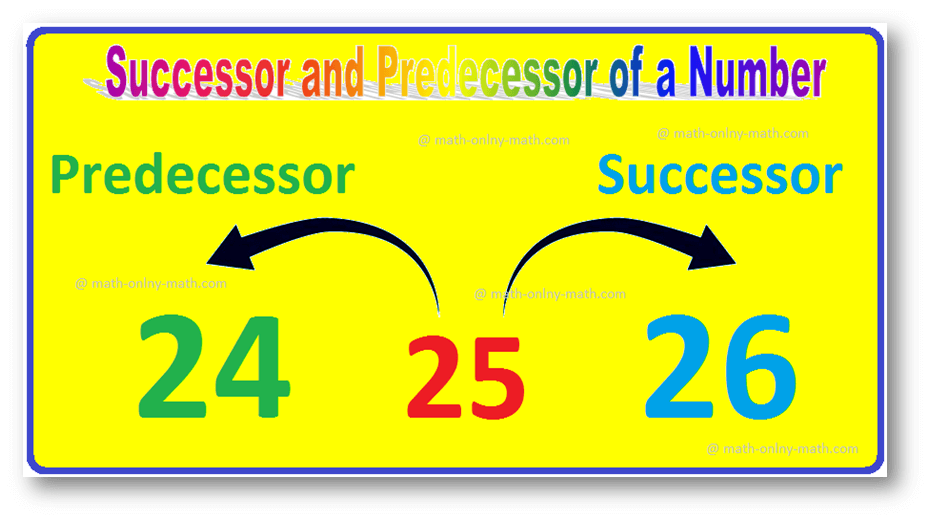 The number that comes just before a number is called the predecessor. So, the predecessor of a given number is 1 less than the given number. Successor of a given number is 1 more than the given number…
New! Comments
Have your say about what you just read! Leave me a comment in the box below. Ask a Question or Answer a Question.