Subscribe to our ▶️ YouTube channel 🔴 for the latest videos, updates, and tips.
Plot Points on Coordinate Graph
How do you plot points on coordinate graph?
We draw co-ordinate axes X'OX, extended ‘side-by side’ and Y'OY, extended ‘above and below’ and take x-axis and y-axis respectively. Then we have to decide how any sides of the small square may be taken as one unit such that one centimeter represents one unit on both the axes. According to that unit and sign of abscissa and ordinate, the location of the point is found.
Example to plot points on a coordinate graph paper:
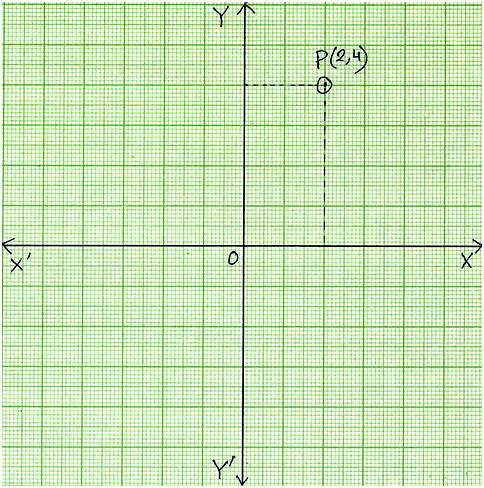
1. Plot point P(2, 4) on the graph.
Solution:
On the graph paper X'OX and Y'OY are indicated as x-axis and y-axis respectively. Length of one sides of the square (i.e. 1 div) is taken as unit.
In point P(2, 4) we observe that both the co-ordinates are positive so they will lie in the first quadrant.
Count 2 units along x-axis to the right of origin. Draw a
line BA ┴ XOX'.
Now, count 4 units along y-axis upward. Draw line CD ┴ YOY'.
Both these lines intersect at point P.
Therefore, the co-ordinates of point P are (2, 4).
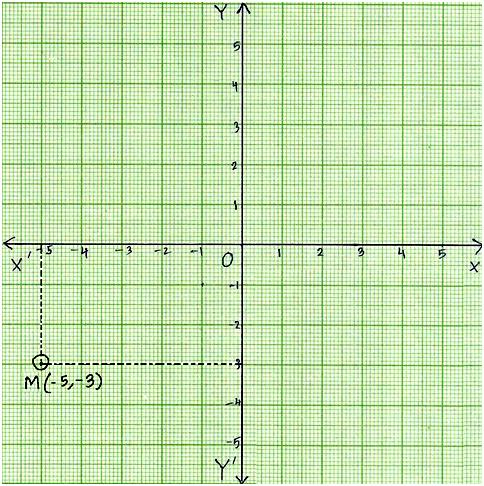
2. Plot point M(-5, -3) on the graph.
Solution:
On the graph paper X'OX and Y'OY are indicated as x-axis and y-axis respectively. Length of one sides of the square (i.e. 1 div) is taken as unit.
In point M(-5, -3) we observe that both the co-ordinates i.e. abscissa (-5) and ordinate (-3) are negative so they will lie in the third quadrant.
Count 5 units along x-axis to the left of origin. Draw a line QP ┴ X'OX.
Now, count 3 units along y-axis downward. Draw line RS ┴ Y'OY.
Both these lines intersect at point M.
Therefore, the co-ordinates of point M are (-5, -3).
Note:
Any point on x-axis: The co-ordinates of any point on the x-axis are of the form (x, 0).
Therefore the y co-ordinate of every point on x axis is zero.
For example: (2, 0), (7, 0), (5, 0), (-2, 0), (-7, 0), (-2, 0) are the points which lie on x –axis.
Any point on y-axis: The co-ordinates of any point on the y-axis are of the form (0, y).
Therefore the x co-ordinate of every point on y axis is zero.
For example: (0, 1), (0, 4), (0, 6), (0, -1), (0, -4), (0, -6) are the points which lie on y-axis.
Related Concepts:
● Ordered pair of a Coordinate System
● Find the Coordinates of a Point
● Coordinates of a Point in a Plane
● Plot Points on Coordinate Graph
● Simultaneous Equations Graphically
● Graph of Perimeter vs. Length of the Side of a Square
● Graph of Area vs. Side of a Square
● Graph of Simple Interest vs. Number of Years
From Plot Points on Coordinate Graph to HOME PAGE
Didn't find what you were looking for? Or want to know more information about Math Only Math. Use this Google Search to find what you need.


New! Comments
Have your say about what you just read! Leave me a comment in the box below. Ask a Question or Answer a Question.