Subscribe to our ▶️ YouTube channel 🔴 for the latest videos, updates, and tips.
Graph of Linear Equation
How to represent a graph of linear equation in two variables?
Linear equation in two variables is represented graphically by the line whose points give the collection of solutions of the equation. This is called graphing linear equation.
Properties for graphing linear equation:
1. Linear equations have infinitely many solutions.
2. Every point (h, k) on the line AB gives the solution x = h and y = k.
3. Every point which lies on AB satisfies the equation of AB.
4. To draw an exact line on the graph paper you can plot as many points you like, but it is necessary to plot minimum three points.
Method
to draw the graph of linear equation in two variables:
1. Convert the given equation in the form of y = mx + b (slope intercept form).
2. Apply trial and error method to find 3 pairs of values of (x, y) which satisfy the given equation.
3. Plot these points on the graph paper.
4. Join the points marked on the graph paper to get a straight line which represent the given equation graphically.
Note:
1. Linear equation in two variables has infinitely many solutions.
2. A graph of linear equation is always a straight line.
3. Every point on the straight line is the solution of the linear equation.
4. Equation of y-axis is x = 0. The standard form of this equation is x + 0.y = 0.
5. Equation of x-axis is y = 0. The standard form of this equation is 0.x + y = 0.
6. x = a is a graph of straight line parallel to y-axis and standard form of this equation is x + 0.y = a
7. y = b is a graph of straight line parallel to x-axis and standard form of this equation is 0.x + y = b.
8. The equation y = mx is always passing through the origin (0, 0).
Learn the steps for graphing linear equation in two variables:
1. Draw the graph of the linear equation y = 2x.
Solution:
The given linear equation y = 2x is already in the form of y = mx + b [here b = 0].
Now we will apply the trial and error method to find 3 pairs of values of (x, y) which satisfy the given equation y = 2x.
When the value of x = 0, then y = 2 × 0 = 0
When the value of x = 1, then y = 2 × 1 = 2
When the value of x = 3, then y = 2 × 3 = 6
When the value of x = -1, then y = 2 × -1 = -2
When the value of x = -2, then y = 2 × -2 = -4
Arrange the values of the linear equation y = 2x in the table.
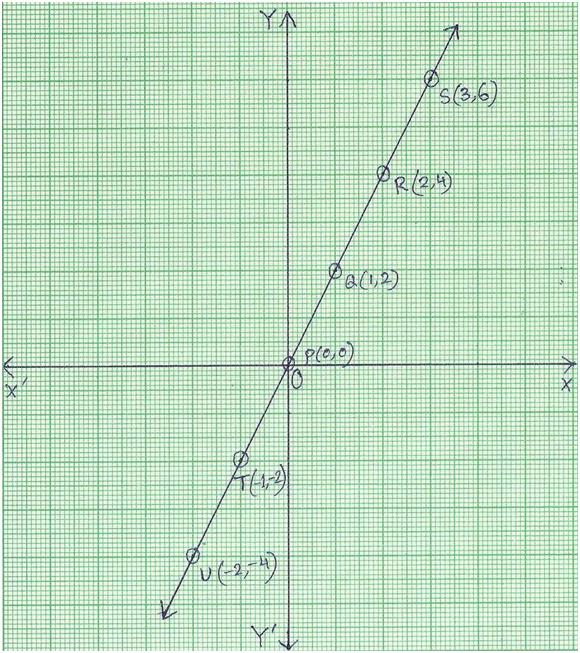
Now, plot the points P (0, 0), Q (1, 2), R (2, 4), S (3, 6), T (-1, -2), U (-2, -4) on the graph paper.
Join the points of P, Q, R, S, T and U.
We get a straight line passing through origin. This straight line is the graph of the equation y = 2x.
2. Draw the graph
of the equation 4x - y = 3.
Solution:
The given linear equation 4x - y = 3.
Now convert the given equation in the form of y = mx + b
4x - y = 3
⇒ 4x - 4x - y = - 4x + 3
⇒ - y = - 4x + 3
⇒ y = 4x - 3
Now we will apply the trial and error method to find 3 pairs of values of (x, y) which satisfy the given equation y = 4x - 3.
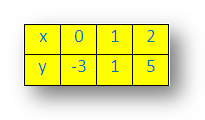
When the value of x = 0, then y = (4 × 0) - 3 = - 3
When the value of x = 1, then y = (4 × 1) - 3 = 1
When the value of x = 2, then y = (4 × 2) - 3 = 5
Arrange these value of the linear equation y = 4x - 3 in the table.
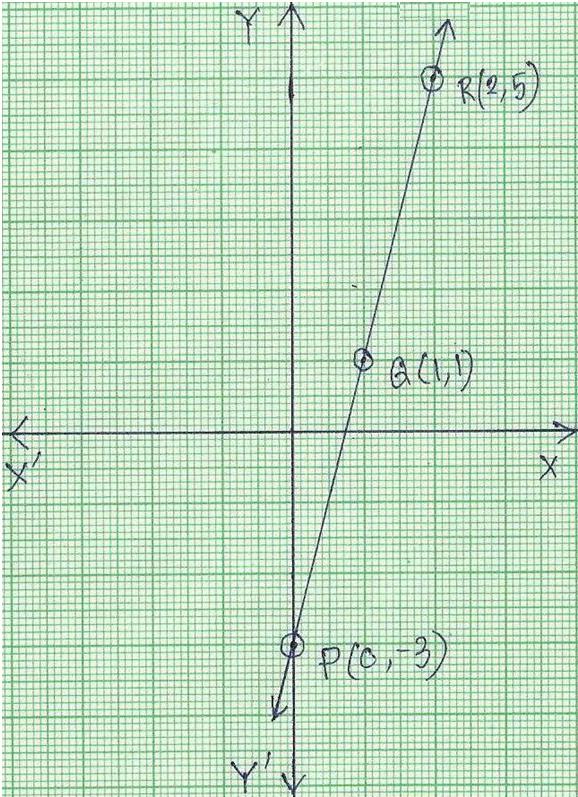
Now, plot the point P (0, -3), Q (1, 1), R(2, 5) on the graph.
Join the points of P, Q and R.
We get a straight line passing through origin. This straight line is the graph of linear equation 4x - y = 3.
Related Concepts:
● Ordered pair of a Coordinate System
● Find the Coordinates of a Point
● Coordinates of a Point in a Plane
● Plot Points on Co-ordinate Graph
● Simultaneous Equations Graphically
● Graph of Perimeter vs. Length of the Side of a Square
● Graph of Area vs. Side of a Square
● Graph of Simple Interest vs. Number of Years
7th Grade Math Problems
8th Grade Math Practice
From Graph of Linear Equation to HOME PAGE
Didn't find what you were looking for? Or want to know more information about Math Only Math. Use this Google Search to find what you need.


New! Comments
Have your say about what you just read! Leave me a comment in the box below. Ask a Question or Answer a Question.