Subscribe to our ▶️ YouTube channel 🔴 for the latest videos, updates, and tips.
Area of the Triangle Formed by Three co-ordinate Points
Here we will discuss about the area of the triangle formed by three co-ordinate points.
How to find the area of the triangle formed by joining the three given points?
(A) In Terms of Rectangular Cartesian Co-ordinates:
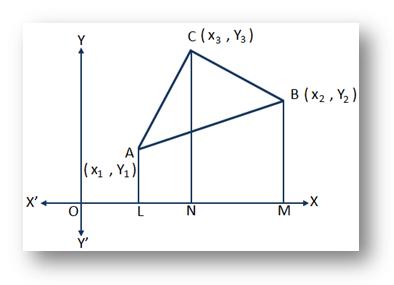
Let (x₁, y₁), (x₂, y₂) and (x₃, y₃) be the co-ordinates of the vertices A, B, C respectively of the triangle ABC. We are to find the area of the triangle ABC.
Draw AL, BM and CN perpendiculars from A, B and C respectively on the x-axis.
Then, we have, OL = x₁, OM = x₂, ON = x₃ and AL = y₁, BM = y₂, CN = y₃.
Therefore, LM = OM - OL = x₂ - x₁;
NM = OM - ON = x₂ - x₃;
and LN = ON - OL = x₃ - x₁.
Since the area of a trapezium = \(\frac{1}{2}\) × the sum of the parallel sides × the perpendicular distance between them,
Hence, the area of the triangle ABC = ∆ABC
= area of the trapezium ALNC + area of the trapezium CNMB - area of the trapezium ALMB
= \(\frac{1}{2}\) ∙ (AL + NC) . LN + \(\frac{1}{2}\) ∙ (CN + BM) ∙ NM - \(\frac{1}{2}\) ∙ (AL + BM).LM
= \(\frac{1}{2}\) ∙ (y₁ + y₃) (x₃ - x₁) + \(\frac{1}{2}\) ∙ (y₃ + y₂) (x₂ - x₃) - \(\frac{1}{2}\) ∙ (y₁ + y₂) (x₂ - x₁)
= \(\frac{1}{2}\) ∙ [x₁ y₂ - y₁ x₂ + x₂ y₃ - y₂ x₃ + x₃ y₁ - y₃ x₁]
= \(\frac{1}{2}\)[x₁ (y₂ - y₃) + x₂ (y₃ - y₁) + x₃ (y₁ - y₂)] sq. units.
Note:
(i) The area of the triangle ABC can also be expressed in the following form:
∆ ABC= \(\frac{1}{2}\)[y₁ (x₂ - x₃) + y₂ (x₃ - x₁) + y₃ (x₁ - x₂)] sq. units.
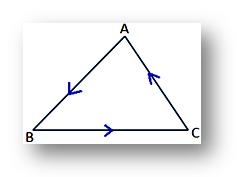
(ii)The above expression for the area of the triangle ABC will be positive if the vertices A, B, C are taken in the anti-clockwise direction as shown in the given figure;
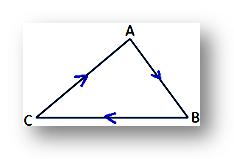
on the contrary, the expression for the area of the triangle will be negative if the vertices A, B and C are taken in the clockwise direction as show in the given figure.
However, in either case the numerical value of the expression would be the same.
Therefore, for any position of the vertices A, B and C we can write,
∆ ABC = \(\frac{1}{2}\)| x₁ (y₂ - y₃) + x₂ (y₃ - y₁) + x₃ (y₁ - y₂) | sq. units.
(iii) The following short-cut method is often used to find the area of the triangle ABC:
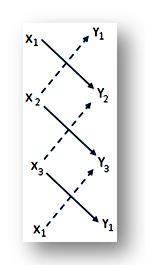
Write in three rows the co-ordinates (x₁, y₁), (x₂, y₂) and (x₃, y₃) of the vertices A, B, C respectively and at the last row write again the co-ordinates (x₁, y₁), of the vertex A. Now, take the sum of the product of digits shown by (↘) and from this sum subtract the sum of the products of digits shown by (↗). The required area of the triangle ABC will be equal to half the difference obtained. Thus,
∆ ABC = \(\frac{1}{2}\)| (x₁ y₂ + x₂ y₃ + x₃ y₁) - (x₂ y₁ + x₃ y₂ + x₁ y₃) | sq. units.
(B) In Terms of Polar Co-ordinates:
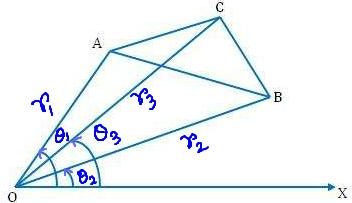
Let (r₁, θ₁), (r₂, θ₂) and (r₃, θ₃) be the polar co-ordinates of the vertices A, B, C respectively of the triangle ABC referred to the pole O and initial line OX.
Then, OA = r₁, OB = r₂, OC = r₃
and ∠XOA = θ₁, ∠XOB = θ₂, ∠ XOC = θ₃
Clearly, ∠AOB = θ₁ - θ₂; ∠BOC = θ₃ - θ₂ and ∠COA = θ₁ - θ₃
Now, ∆ ABC = ∆ BOC + ∆ COA - ∆ AOB
= \(\frac{1}{2}\) OB ∙ OC ∙ sin ∠BOC + \(\frac{1}{2}\) OC ∙ OA ∙ sin ∠COA - \(\frac{1}{2}\) OA ∙ OB ∙ sin ∠AOB
= \(\frac{1}{2}\) [r₂ r₃ sin (θ₃ – θ₂) + r₃ r₁ sin (θ₁ - θ₃) - r₁ r₂ sin (θ₁ - θ₂)] square units
As before, for all positions of the vertices A, B, C we shall have,
∆ABC = \(\frac{1}{2}\)| r₂ r₃ sin (θ₃ – θ₂) + r₂ r₃ sin (θ₁ - θ₃) - r₁ r₂ sin (θ₁ - θ₂) | square units.
Examples on area of the triangle formed by three co-ordinate points:
Find the area of the triangle formed by joining the point (3, 4), (-4, 3) and (8, 6).
Solution:
We know that, ∆ ABC = \(\frac{1}{2}\)| (x₁ y₂ + x₂ y₃ + x₃ y₁) - (x₂ y₁ + x₃ y₂ + ₁ y₃) | sq. units.
The area of the triangle formed by joining the given point
= \(\frac{1}{2}\)| [9 + (-24) + 32] - [-16 + 24 + 18] | sq. units
= \(\frac{1}{2}\)| 17 - 26 | sq. units
= \(\frac{1}{2}\) | – 9 | sq. units
= \(\frac{9}{2}\)sq. units.
● Co-ordinate Geometry
- What is Co-ordinate Geometry?
- Rectangular Cartesian Co-ordinates
- Polar Co-ordinates
- Relation between Cartesian and Polar Co-Ordinates
- Distance between Two given Points
- Distance between Two Points in Polar Co-ordinates
- Division of Line Segment: Internal & External
- Area of the Triangle Formed by Three co-ordinate Points
- Condition of Collinearity of Three Points
- Medians of a Triangle are Concurrent
- Apollonius' Theorem
- Quadrilateral form a Parallelogram
- Problems on Distance Between Two Points
- Area of a Triangle Given 3 Points
- Worksheet on Quadrants
- Worksheet on Rectangular – Polar Conversion
- Worksheet on Line-Segment Joining the Points
- Worksheet on Distance Between Two Points
- Worksheet on Distance Between the Polar Co-ordinates
- Worksheet on Finding Mid-Point
- Worksheet on Division of Line-Segment
- Worksheet on Centroid of a Triangle
- Worksheet on Area of Co-ordinate Triangle
- Worksheet on Collinear Triangle
- Worksheet on Area of Polygon
- Worksheet on Cartesian Triangle
11 and 12 Grade Math
Form Area of the Triangle Formed by Three co-ordinate Points to HOME PAGE
Didn't find what you were looking for? Or want to know more information about Math Only Math. Use this Google Search to find what you need.


New! Comments
Have your say about what you just read! Leave me a comment in the box below. Ask a Question or Answer a Question.