Subscribe to our ▶️ YouTube channel 🔴 for the latest videos, updates, and tips.
Worksheet on Pie Graph
In the worksheet on pie graph the information are given in the questions to draw the circular graph after the calculation.
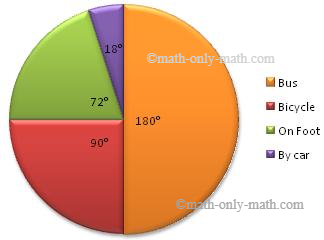
1. The following table shows the mode of transport used by 400 students of a school. Represent the following information on the pie chart. (Show the steps of construction of pie graph for the given data along with the calculation)
| Mode of Transport | Bus | Bicycle | On foot | By car |
| No. of Students | 200 | 100 | 80 | 20 |
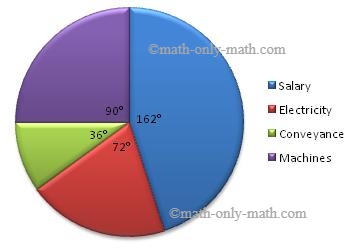
2. The percentage of expenditure of a company under different heads is as follows.
| Heads of Expenditure | Salary | Electricity | Conveyance | Machines |
| Percentage | 45 % | 20 % | 10 % | 25 % |
Represent this information on a pie graph. (Show the steps of construction of pie graph for the given data along with the calculation)
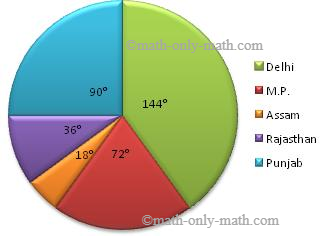
3. The percentage of lottery tickets sold by an
agent of different states is given below. Draw a pie chart. (Show the steps of construction of pie chart for the given data along
with the calculation)
| States | Delhi | M.P. | Assam | Rajasthan | Punjab |
| % of Tickets Sold | 40 | 20 | 5 | 10 | 25 |
Answers for the worksheet on pie graph are drawn below after calculating the central angles for the various observations, to represent these angles within a circle to obtain the required pie chart.
Answers:
1.

2.

3.

● Statistics - Worksheets
- Worksheet on Frequency Distribution
- Worksheet on Mean Median and Mode
- Worksheet on Bar Graph
- Worksheet on Pie Graph
- Worksheet on Line Graph
From Worksheet on Pie Graph to HOME PAGE
Didn't find what you were looking for? Or want to know more information about Math Only Math. Use this Google Search to find what you need.


New! Comments
Have your say about what you just read! Leave me a comment in the box below. Ask a Question or Answer a Question.