Subscribe to our ▶️ YouTube channel 🔴 for the latest videos, updates, and tips.
Worksheet on Line Graph
In the worksheet on line graph the points are plotted on the graph related to two variables and then the points are joined by the line segments.
1. The following are the runs scored by a team in the first 5 overs:
| Match | 1 | 2 | 3 | 4 | 5 | 6 | 7 | 8 | 9 | 10 |
| Runs Scored | 6 | 4 | 2 | 0 | 10 | 20 | 15 | 6 | 18 | 12 |
Draw the line graph for the above data.
2. Draw the line graph showing the following information. The table shows the colours favoured by a group of people.
| Colours | Yellow | Pink | Blue | Green | Orange |
| No. of People | 16 | 20 | 30 | 26 | 34 |
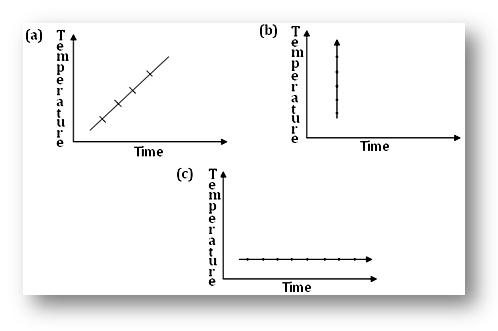
3. Can there be time-temperature graphs as follows? Give reason.
4. The following tables give the information about a patient’s body temperature recorded in the hospital every hour.
| Time | 9 am | 10 am | 11 am | 12 noon | 1 pm | 2 pm | 3 pm |
| Temperature | 35° C | 36° C | 39° C | 38°C | 36.5° C | 36.5° C | 37° C |
Represent this information on a line graph.
Answers for the worksheet on line graph are given below to check the exact graph and the answers of the above question.
Answers:
1.

2.

3. (a) and (c) possible (b) not possible – time being constant
4.

● Statistics - Worksheets
- Worksheet on Frequency Distribution
- Worksheet on Mean Median and Mode
- Worksheet on Bar Graph
- Worksheet on Pie Graph
- Worksheet on Line Graph
From Worksheet on Line Graph to HOME PAGE
Didn't find what you were looking for? Or want to know more information about Math Only Math. Use this Google Search to find what you need.


