Worksheet on Line Graph
In the worksheet on line graph the points are plotted on the graph related to two variables and then the points are joined by the line segments.
1. The following are the runs scored by a team in the first 5 overs:
| Match | 1 | 2 | 3 | 4 | 5 | 6 | 7 | 8 | 9 | 10 |
| Runs Scored | 6 | 4 | 2 | 0 | 10 | 20 | 15 | 6 | 18 | 12 |
Draw the line graph for the above data.
2. Draw the line graph showing the following information. The table shows the colours favoured by a group of people.
| Colours | Yellow | Pink | Blue | Green | Orange |
| No. of People | 16 | 20 | 30 | 26 | 34 |
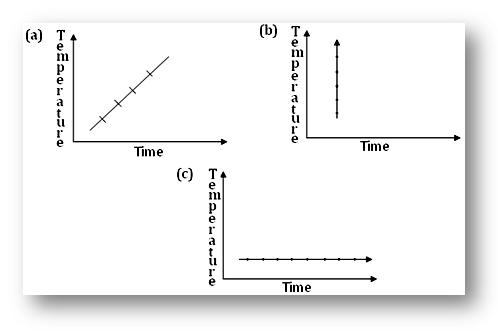
3. Can there be time-temperature graphs as follows? Give reason.
4. The following tables give the information about a patient’s body temperature recorded in the hospital every hour.
| Time | 9 am | 10 am | 11 am | 12 noon | 1 pm | 2 pm | 3 pm |
| Temperature | 35° C | 36° C | 39° C | 38°C | 36.5° C | 36.5° C | 37° C |
Represent this information on a line graph.
Answers for the worksheet on line graph are given below to check the exact graph and the answers of the above question.
Answers:
1.

2.

3. (a) and (c) possible (b) not possible – time being constant
4.

● Statistics - Worksheets
- Worksheet on Frequency Distribution
- Worksheet on Mean Median and Mode
- Worksheet on Bar Graph
- Worksheet on Pie Graph
- Worksheet on Line Graph
From Worksheet on Line Graph to HOME PAGE
Didn't find what you were looking for? Or want to know more information about Math Only Math. Use this Google Search to find what you need.


Recent Articles
-
Comparison of Numbers | Compare Numbers Rules | Examples of Comparison
May 16, 24 02:09 PM
 Rule I: We know that a number with more digits is always greater than the number with less number of digits. Rule II: When the two numbers have the same number of digits, we start comparing the digits…
 -
Numbers | Notation | Numeration | Numeral | Estimation | Examples
May 12, 24 06:28 PM
Numbers are used for calculating and counting. These counting numbers 1, 2, 3, 4, 5, .......... are called natural numbers. In order to describe the number of elements in a collection with no objects -
Face Value and Place Value|Difference Between Place Value & Face Value
May 12, 24 06:23 PM
 What is the difference between face value and place value of digits? Before we proceed to face value and place value let us recall the expanded form of a number. The face value of a digit is the digit…
 -
Patterns in Numbers | Patterns in Maths |Math Patterns|Series Patterns
May 12, 24 06:09 PM
 We see so many patterns around us in our daily life. We know that a pattern is an arrangement of objects, colors, or numbers placed in a certain order. Some patterns neither grow nor reduce but only r…
 -
Worksheet on Bar Graphs | Bar Graphs or Column Graphs | Graphing Bar
May 12, 24 04:59 PM
 In math worksheet on bar graphs students can practice the questions on how to make and read bar graphs or column graphs. Test your knowledge by practicing this graphing worksheet where we will
New! Comments
Have your say about what you just read! Leave me a comment in the box below. Ask a Question or Answer a Question.