Subscribe to our ▶️ YouTube channel 🔴 for the latest videos, updates, and tips.
Worksheet on Finding the Mean of Arrayed Data
In worksheet on finding the mean of arrayed data we will solve various types of practice questions on measures of central tendency. Here you will get 12 different types of questions on finding the mean of arrayed data.
1. Find the mean.
Variate
50
100
150
200
Frequency
6
3
8
3
2. Find the mean.
Age (in Years)
11
12
13
14
15
16
17
Number of Students
3
4
6
10
8
7
5
3. Find the mean of the following cumulative-frequency distributions.
Variate
5
10
15
20
Cumulative Frequency
6
10
14
16
4. Find the mean of the following cumulative-frequency distributions.
Variate
2
4
6
8
10
12
Cumulative Frequency
7
10
15
22
28
35
5. The mean of the variates 2, 4, 6 and 8 is \(\frac{54}{11}\), and the frequencies of the first three variates are 3, 2 and 4. Find the frequency of the fourth variate.
6. Find the variates 5, 15, 25, 35 and 45 have the frequencies 2, 10, 8, 7 and x. If the mean of the variates be \(\frac{74}{3}\) then find x.
7. In the following frequency table, a frequency f is obscure. If the mean of the distribution is 20.6 then find the frequency f.
Variate
10
15
20
25
35
Cumulative Frequency
6
10
14
16
5
8. The mean of the following frequency distribution is 22.5. Find the value of x.
Variate
5
15
25
x
45
Cumulative Frequency
2
4
3
1
2
9. The mark obtained by a set of students in an examination are given below.
Marks
5
10
15
20
25
30
Number of Students
6
4
6
12
x
4
Given that the mean mark of the set is 18, calculate the numerical value of x.
10. The contents of 100 matchboxes were checked to determine the number of matches they contained.
Number of matches
35
36
37
38
39
40
41
Number of Boxes
6
10
18
25
21
12
8
(i) Calculate, correct to one decimal place, the mean number of matches per box.
(ii) Determine how many extra matches would have to be added to the total contents of the 100 boxes to bring the mean up to exactly 39 matches.
11.
|
Category |
A |
B |
C |
D |
E |
F |
G |
|
Wages per day (in Dollar) |
50 |
60 |
70 |
80 |
90 |
100 |
110 |
|
Number of Workers |
2 |
4 |
8 |
12 |
10 |
6 |
8 |
(i) Calculate the mean wage, correct to the nearest dollar.
(ii) If the number of workers in each category is doubled, what would be the new mean wage?
(iii) If the number of workers in each category is increased by 2, what would be the new mean wage?
12. Calculate the mean of the following distribution.
Variate
1
2
3
4
5
6
Cumulative Frequency
4
7
15
21
31
35
13. The marks of 20 students in a test were as follows.
5, 6, 8, 9, 10, 11, 11, 12, 13, 13, 14, 14, 15, 15, 15, 16, 16, 18, 19, 20
Calculate the mean mark.
14. (i) Apply the short-cut method to calculate the mean (to the nearest dollar) of the following distribution.
Monthly Pocket Money (in Dollar)
100
120
140
160
180
200
Number of Students
5
10
8
6
11
10
(ii) Using assumed mean a = 30, calculate the mean of the following distribution.
Variate
10
20
30
40
50
Cumulative Frequency
12
31
50
67
80
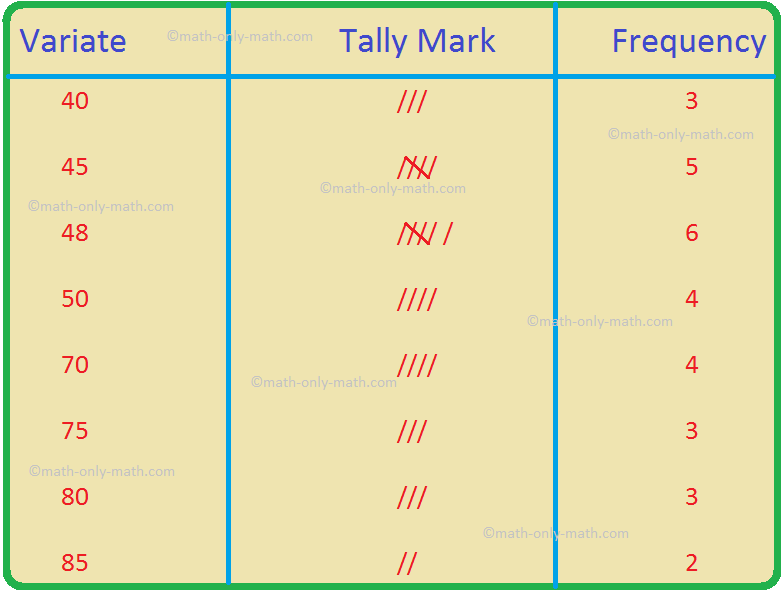
15. The number of hours of TV viewing per month by 30 families of an area are given below.
45, 48, 70, 48, 75, 40, 45, 50, 50, 48, 75, 70, 80, 80, 45, 50, 45, 50, 40, 48, 85, 70, 80, 45, 85, 70, 48, 48, 75, 40
(i) Construct a frequency table for the data.
(ii) Find the mean of the hours of TV watched by the direct method.
(iii) Find the mean of the hours of TV watched by the short-cut method.
Answers on Worksheet on Finding the Mean of Arrayed Data are given below to check the exact answers of the questions.
Answers:
1. 120
2. 14.3 years
3. 10.625
4. 7.31
5. 2
6. 3
7. 25
8. 35
9. 8
10. (i) 38.1
(ii) 87
11. (i) $ 85
(ii) $ 85
(iii) 83.75
12. 3.77
13. 13
14. (i) $ 155.20
(ii) 30
15. (i)
(ii) 58.27 hours
(iii) 58.27 hours
From Worksheet on Finding the Mean of Arrayed Data to HOME PAGE
Didn't find what you were looking for? Or want to know more information about Math Only Math. Use this Google Search to find what you need.


New! Comments
Have your say about what you just read! Leave me a comment in the box below. Ask a Question or Answer a Question.