Subscribe to our ▶️ YouTube channel 🔴 for the latest videos, updates, and tips.
Graph of Standard Linear Relations Between x, y
Here we will learn how to draw the graph of standard linear relations between x, y
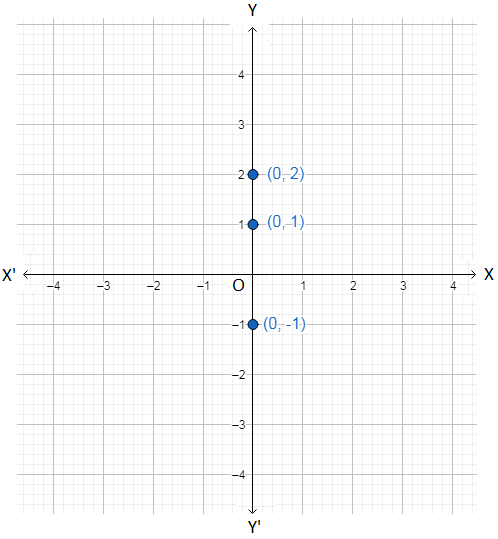
(i) Graph of x = 0
Some of the orders pairs of values of (x, y) satisfying x = 0 are (0, 1), (0, 2), (0, -1), etc.
All the points corresponding to these ordered pairs are on the y-axis because their x-coordinates are 0. Thus,
the graph of x = 0 is the y-axis
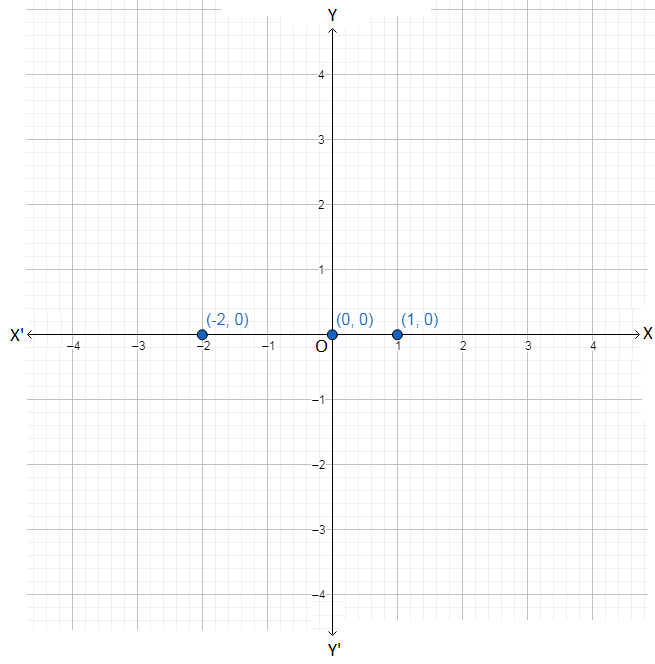
(ii) Graph of y = 0
Some of the ordered pairs of values of (x, y) satisfying y = 0 are (0, 0), (1, 0), (-2, 0), etc.
All these points are on the x-axis, their y-coordinates
being 0.
Thus,
the graph of y = 0 is the x-axis
(iiI) Graph of x = a
Some of the ordered pairs of values of (x, y) satisfying x = a are (a, 0), (a, 1), (a, 2), etc.
All these points have the same x-coordinate, a. Plotting these points and joining them by a straight line we get the graph of x = a. We find that
the graph of x = a is a straight line parallel to y-axis at a distance a from the y-axis, on the right if a > 0 and on the left if a < 0.


(iv) Graph of y = a.
Some of the ordered pairs of values (x, y) satisfying y = a are (0, a), (1, a), (3, a), etc.
All these points have the same y-coordinate, a. Plotting these points and joining them by a straight line we get the graph of y = a. We find that
the graph of y = a is a straight line parallel to x-axis at a distance a from the x-axis, above the x-axis if a > 0 and below the x-axis if a < 0.


Graph of y = x
Some of the ordered pairs of values of (x, y) satisfying y = x are (0, 0), (-1, -1), (2, 2) etc. All these points have equal x and y coordinates.

So, the points are at equal distances from both the x-axis and y-axis and are in the first quadrant or the third quadrant. Thus,
the graph of y = x is the internal bisector of the angle XOY
From Graph of Standard Linear Relations Between x, y to HOME PAGE
Didn't find what you were looking for? Or want to know more information about Math Only Math. Use this Google Search to find what you need.


