Subscribe to our ▶️ YouTube channel 🔴 for the latest videos, updates, and tips.
Method of Constructing a Frequency Polygon with the Help of a Histogram
We will discuss about the method of constructing a frequency polygon with the help of a histogram.
Step I: Draw the histogram for the frequency distribution as explained above.
Step II: Locate the midpoint of the top horizontal side of each rectangle in the histogram.
Step III: Locate the middle points on the horizontal axis of two imaginary intervals of common size, one before the first class interval and the other after the last class interval.
Step IV: Join all the above midpoints by line segments one after the other in order.
Example: Draw the frequency polygon for the following frequency distribution.
Marks Obtained
Under 20
Under 40
Under 60
Under 80
Under 100
Number of Students
6
10
20
36
50
Solution: Changing the distribution into a continuous distribution of overlapping intervals, we have the following table.
Marks Obtained
0 - 20
20 - 40
40 - 60
60 - 80
80 - 100
Number of Students
6
4
(10 - 6)
10
(20 - 10)
16
(36 - 20)
14
(50 - 36)
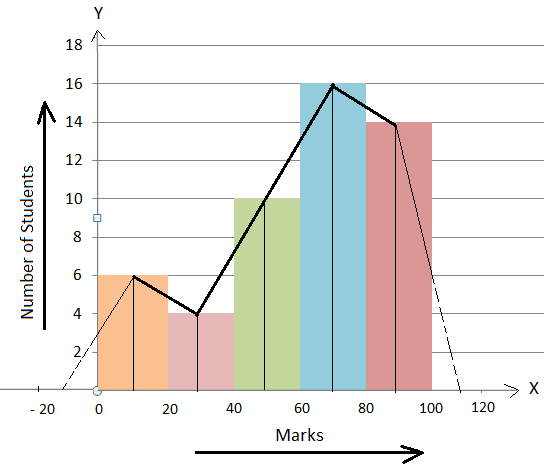
The histogram of the distribution is shown in the adjacent figure.
Following steps II, III and IV, the frequency polygon will be as shown alongside.
Scale: On the x-axis, 1 cm = 20 marks.
On the y-axis, 2 mm = 1 student.
From Method of Constructing a Frequency Polygon with the Help of a Histogram to HOME PAGE
Didn't find what you were looking for? Or want to know more information about Math Only Math. Use this Google Search to find what you need.


New! Comments
Have your say about what you just read! Leave me a comment in the box below. Ask a Question or Answer a Question.