Subscribe to our ▶️ YouTube channel 🔴 for the latest videos, updates, and tips.
Drawing Graph of y = mx + c Using Slope and y-intercept
Here we will learn how to draw the graph of a linear relation between x and y is a straight line.
So, the graph of y = mx + c is a straight line. We know its slope is m and y-intercept is c. By knowing the slope and y-intercept for a line graph, the graph can be easily drawn.
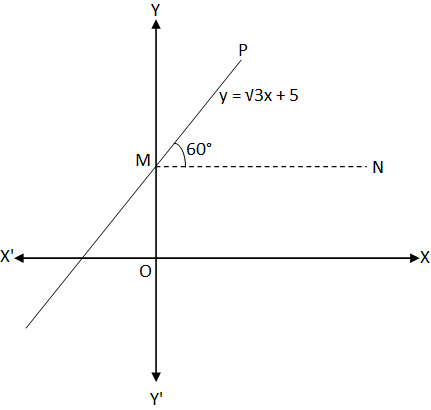
For example: In y = √3x +5, we have slope = √3 and y-intercept = 5
As tan 60° = √3, the graph can be drawn as shown below.
Step I: Take a point M on the y-axis in the positive direction of the y-axis such that OM = 5.
Step II: Through M draw a line MN parallel to the x-axis.
Step III: Draw a line MP through M such that the line makes an angle 60° with MN (positive direction of the x-axis). This is the required graph of y = √3x + 5.
From Drawing Graph of y = mx + c Using Slope and y-intercept to HOME PAGE
Didn't find what you were looking for? Or want to know more information about Math Only Math. Use this Google Search to find what you need.


New! Comments
Have your say about what you just read! Leave me a comment in the box below. Ask a Question or Answer a Question.