Subscribe to our ▶️ YouTube channel 🔴 for the latest videos, updates, and tips.
Bar Graph on Graph Paper
To make drawing graphs easier, we use a graph paper. It usually has lines on every millimeter, both horizontally and vertically. The horizontal and vertical lines are perpendicular to each other the dark lines are 1 cm apart. This creates large boxes of side 1 cm, and small boxes of side 1 mm.
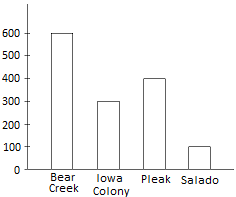
The population recorded in 4 villages was
|
Village |
Bear Creek |
Iowa Colony |
Pleak |
Salado |
|
Population |
600 |
300 |
400 |
100 |
Display this data by a bar graph. The bar graph is shown below.
Scale
First we need to choose the scale for the graph. For this, note the highest and the lowest values. Here, the highest value is 600, and the lowest value is 100. The scale chosen should be such that the bar for the highest value fits easily on the paper. Also, the scale should be such that the bar for the lowest value can be easily fitted. So we choose a scale in which 1 cm length represents 100 people.
5th Grade Math Problems
From Bar Graph on Graph Paper to HOME PAGE
Didn't find what you were looking for? Or want to know more information about Math Only Math. Use this Google Search to find what you need.


New! Comments
Have your say about what you just read! Leave me a comment in the box below. Ask a Question or Answer a Question.