Subscribe to our ▶️ YouTube channel 🔴 for the latest videos, updates, and tips.
Home | About Us | Contact Us | Privacy | Math Blog
Worksheet on Constants and Variables
Practice the questions given in the worksheet on constants and variables. The questions are related to constants and variables which are the two basic symbols in algebra.
1. Separate, constants and variables from the following:
5, 6z, -12x, 7/5, 3/4xz, mn, 2p, 0, 3x/4, 7/12k, -pt/2m, 1/2
2. State whether the following statements are true or false:
(i) 12 is a constant and z is a variable but 12z is variable.
(ii) 7 is constant and p is variable but together 7 + p is a variable.
(iii) 13 is constant and m is variable but together 13 - m is a constant.
(iv) 11 is constant and n is variable but together 11 n is a constant.
(v) 0 is a variable.
(vi) Combination of both a constant and a variable is also variable.
(vii) A quantity which takes a fix numerical value is called variable.
(viii) A quantity or symbol which has a no fixed value but it can represent any numerical values is called variable.
(ix) 15x, z/3, 7/m are some of the examples of constants.
(x) x, a + b, c – 2, a 13 are some of the examples of variables.
3. Fill in the blanks:
(i) In -3x, _____ is constant and _____ is variable.
(ii) In 10ab, _____ is constant and _____ are variables.
(iii) In 15mn/k, _____ is constant and _____ are variables.
(iv) In 27a/8b, _____ are constants and _____ are variables.
4. 91y + 5, find the constants.
5. 32m + 9n, find the variables.
Answers for the worksheet on constants and variables are given below to check the exact answers of the above questions.
Answers:
1. 5, 7/5, 0 and 1/2 are constants.
6z, -12x, 3/4xz, mn, 2p, 3x/4, 7/12k, -pt/2m are variables.
2. (i) True
(ii) True
(iii) False
(iv) False
(v) False
(vi) True
(vii) False
(viii) True
(ix) False
(x) True
3. (i) In -3x, -3 is constant and x is variable.
(ii) In 10ab, 10 is constant and a and b are variables.
(iii) In 15mn/k, 15 is constant and m, n and k are variables.
(iv) In 27a/8b, 27 and 8 are constants and a and b are variables.
4. 91 and 5 are the constants.
5. m and n are the variables.
Math Home Work Sheets
From Worksheet on Constants and Variables to HOME PAGE
Didn't find what you were looking for? Or want to know more information about Math Only Math. Use this Google Search to find what you need.

Recent Articles
-
Worksheet on Area, Perimeter and Volume | Square, Rectangle, Cube,Cubo
Jul 25, 25 12:21 PM
In this worksheet on area perimeter and volume you will get different types of questions on find the perimeter of a rectangle, find the perimeter of a square, find the area of a rectangle, find the ar… -
Worksheet on Volume of a Cube and Cuboid |The Volume of a RectangleBox
Jul 25, 25 03:15 AM
 We will practice the questions given in the worksheet on volume of a cube and cuboid. We know the volume of an object is the amount of space occupied by the object.1. Fill in the blanks:
 -
Volume of a Cuboid | Volume of Cuboid Formula | How to Find the Volume
Jul 24, 25 03:46 PM
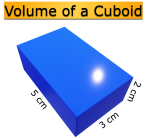 Cuboid is a solid box whose every surface is a rectangle of same area or different areas. A cuboid will have a length, breadth and height. Hence we can conclude that volume is 3 dimensional. To measur…
 -
Volume of a Cube | How to Calculate the Volume of a Cube? | Examples
Jul 23, 25 11:37 AM
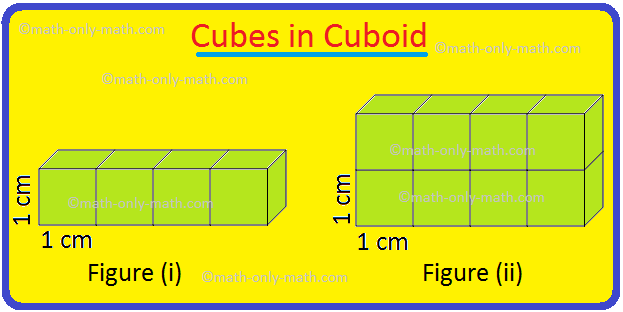
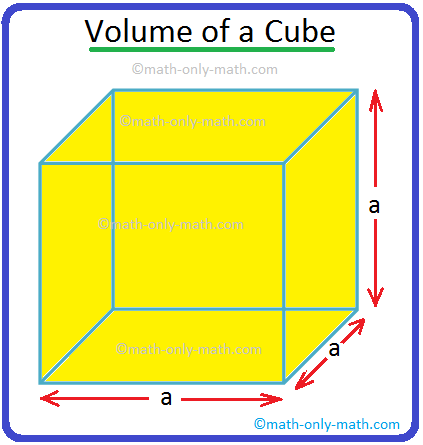 A cube is a solid box whose every surface is a square of same area. Take an empty box with open top in the shape of a cube whose each edge is 2 cm. Now fit cubes of edges 1 cm in it. From the figure i…
 -
5th Grade Volume | Units of Volume | Measurement of Volume|Cubic Units
Jul 20, 25 10:22 AM
 Volume is the amount of space enclosed by an object or shape, how much 3-dimensional space (length, height, and width) it occupies. A flat shape like triangle, square and rectangle occupies surface on…
New! Comments
Have your say about what you just read! Leave me a comment in the box below. Ask a Question or Answer a Question.