Subscribe to our ▶️ YouTube channel 🔴 for the latest videos, updates, and tips.
Finding the Mean from Graphical Representation
Here we will learn how to find the mean from graphical representation.
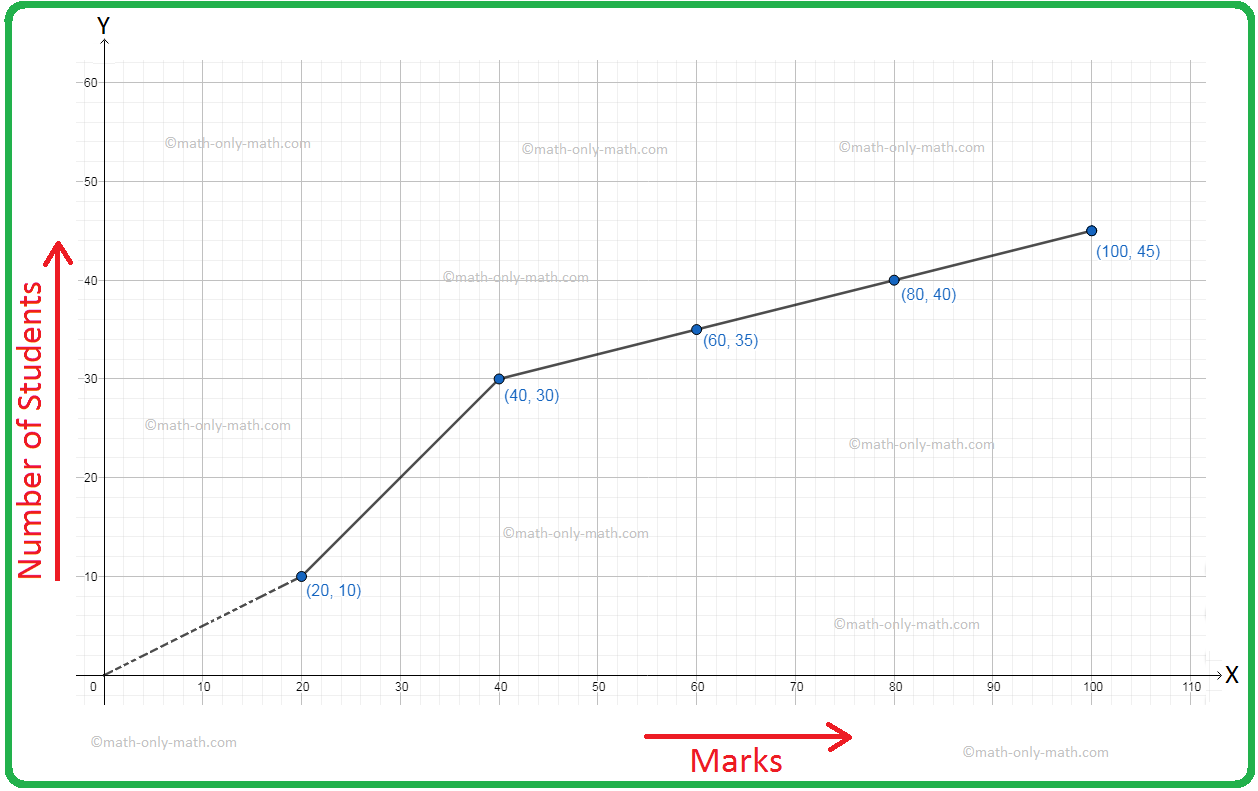
The ogive of the distribution of marks of 45 students is given below.
Find the mean of the distribution.
Solution:
The cumulative-frequency table is as given below.
Marks
Under 20
Under 40
Under 60
Under 80
Under 100
Number of Students
10
30
35
40
45
Writing in overlapping class intervals, the distribution is as below.
Marks
0 - 20
20 - 40
40 - 60
60 - 80
Under 100
Number of Students
10
20
5
5
5
The calculations are as given below.
|
Class Interval |
Class Mark (mi) |
Frequency (fi) |
mifi |
|
0 - 20 |
10 |
10 |
100 |
|
20 - 40 |
30 |
20 |
600 |
|
40 - 60 |
50 |
5 |
250 |
|
60 - 80 |
70 |
5 |
350 |
|
80 - 100 |
90 |
5 |
450 |
|
\(\sum f_{i}\) = 45 |
\(\sum m_{i}f_{i}\) = 1750 |
Therefore, mean A = \(\frac{\sum m_{i}f_{i}}{\sum f_{i}}\)
= \(\frac{1750}{45}\)
= 38.89
From Finding the Mean from Graphical Representation to HOME PAGE
Didn't find what you were looking for? Or want to know more information about Math Only Math. Use this Google Search to find what you need.


New! Comments
Have your say about what you just read! Leave me a comment in the box below. Ask a Question or Answer a Question.