Division using Multiplication Tables

Let us learn division using tables.

For examples:

1. Divide 35 ÷ 7

Solution:

1 × 7 = 7; 2 × 7 = 14; 3 × 7 = 21; 4 × 7 = 28; 5 × 7 = 35

Thus, there are 5 sevens in 35.

So, 35 ÷ 7 = 5.

2. Divide 32 ÷ 8

Solution:

1 × 8 = 8; 2 × 8 = 16; 3 × 8 = 24; 4 × 8 = 32

Thus, there are 4 eights in 32.

So, 32 ÷ 8 = 4.

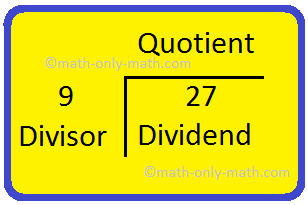
Division Divisor Dividend Quotient

Dividend: The number to be divided is the dividend.

Divisor: The number which divides is the divisor.

Quotient: The answer is the quotient.


Questions and Answers on Division using Multiplication Tables:

1. Divide the following using multiplication table:

(i) 12 ÷ 2

(ii) 63 ÷ 7

(iii) 33 ÷ 11

(iv) 64 ÷ 8

(v) 45 ÷ 5

(vi) 60 ÷ 6

(vii) 27 ÷ 3

(viii) 50 ÷ 10

(ix) 20 ÷ 4

(x) 49 ÷ 7


Answer:

1. (i) 6

(ii) 9

(iii) 3

(iv) 8

(v) 9

(vi) 10

(vii) 9

(viii) 5

(ix) 5

(x) 7


3rd Grade Math Lessons

From Terms Used in Division to HOME PAGE


Didn't find what you were looking for? Or want to know more information about Math Only Math. Use this Google Search to find what you need.


New! Comments

Have your say about what you just read! Leave me a comment in the box below. Ask a Question or Answer a Question.

Share this page: What’s this?

Recent Articles

  1. Worksheet on Pie Chart | Questions on Pie Graphs | Creating Pie Chart

    May 10, 24 05:40 PM

    In math worksheet on pie chart students can practice different types of questions on pie graphs. From the given data we need to calculate the central angle of the components to construct the questions

    Read More

  2. Worksheet on Pictographs | Picture Graph Worksheets | Pictograph Works

    May 10, 24 05:10 PM

    Pictograph Worksheets
    In worksheet on pictographs, all grade students can practice the questions on data handling. We can present the given information in many ways. In pictograph the information is presented by using a pi…

    Read More

  3. Construction of Pie Chart | Steps of Construction | Solved Examples

    May 09, 24 03:25 PM

    Pie Chart
    The pie chart is a pictorial representation of data relative to a whole. Each portion in the circle represent an element of the collected data. The pie chart represents the composition of various elem…

    Read More

  4. Interpreting a Pictograph | Information Regarding the Pictograph |Math

    May 08, 24 02:16 PM

    Interpreting a pictograph
    In interpreting a pictograph, we get a lot of information regarding the pictograph items. The following examples may illustrate the interpretation of pictographs.

    Read More

  5. Pictograph to Represent The Collected Data | Forming Pictograph | Math

    May 07, 24 05:36 PM

    pictograph to represent the collected data
    Pictures or symbols are made in a pictograph to represent the collected data. So, we can say that a pictograph represents the data and gives information quickly and clearly.

    Read More