Subscribe to our ▶️ YouTube channel 🔴 for the latest videos, updates, and tips.
Angle of Depression
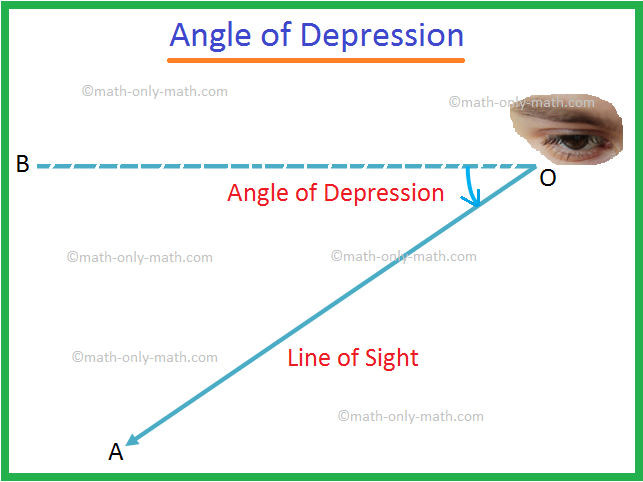
Let O be the eye of an observer and A be an object below the level of the eye. The ray OA is called the line of sight. Let OB be the horizontal line through O. Then the angle BOA is called the angle of depression of the object A as seen from O.
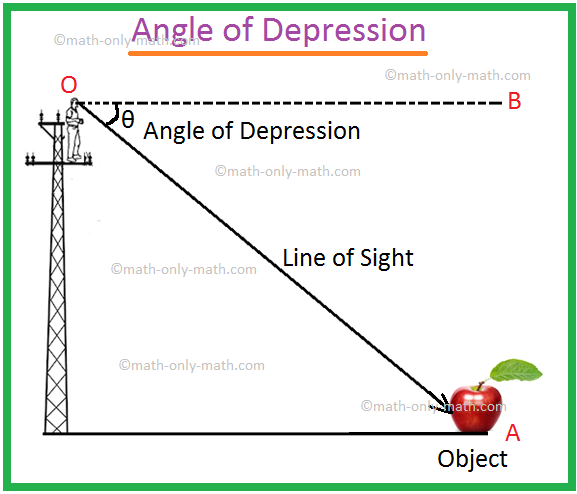
It may so happen that a man climbs up the pole, keeps his eyes at a point O and see the object placed at the point A is the angle of depression of the point A with respect to the point O.
How can we get the angle of depression?
We shall have to imagine a straight line OB parallel to the straight line CA. The measure of the angle of depression will be ∠BOA.
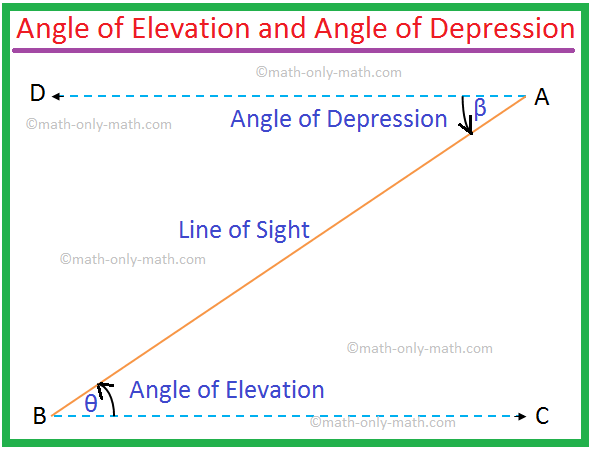
It is clear from the figure below that the angle of elevation of A as seen from B = the angle of depression of B as seen from A.
Therefore, ∠θ = ∠β.
Note: 1. Here, BC ∥ DA and AB is the transversal. So the angle of elevation ∠ABC = the angle of depression ∠BAD. But even then they are to be indicated to solve problems.
2. The observer is taken as a point unless the height of the observer is given.
3. √3 = 1.732 (Approximately).
10th Grade Heights and Distances
Solved Examples on Angle of Depression:
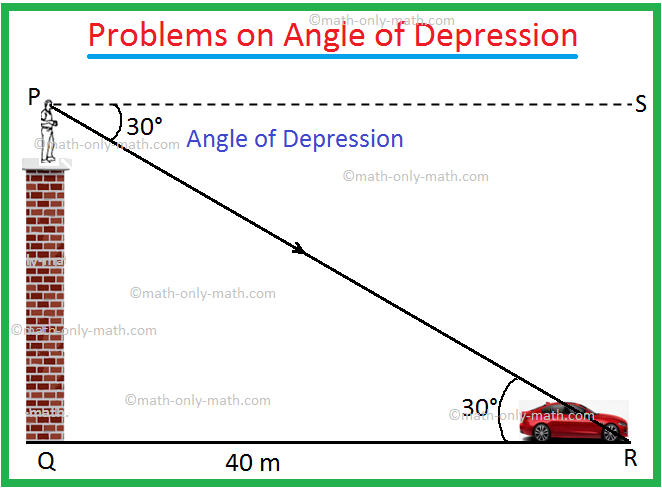
1. From the top of a tower, a man finds that the angle of depression of a car on the ground is 30°. If the car is at a distance 40 metres from the tower, find the height of the tower.
Solution:
Let PQ be the tower and the car is at R.
The angle of depression = ∠SPR = 30° and QR = 40 m.
From geometry, ∠PRQ = ∠SPR = 30°.
In the right-angled ∆PQR,
tan 30° = \(\frac{PQ}{QR}\)
⟹ \(\frac{1}{√3}\) = \(\frac{PQ}{40 m}\)
⟹ √3PQ = 40m
⟹ PQ = \(\frac{40}{√3}\) m
⟹ PQ = \(\frac{40√3}{3}\) m
⟹ PQ = \(\frac{40 × 1.732}{3}\) m
⟹ PQ = 23 m (Approx.).
Therefore, the height of the tower is 23 m (Approx.).
Angle of Depression Example
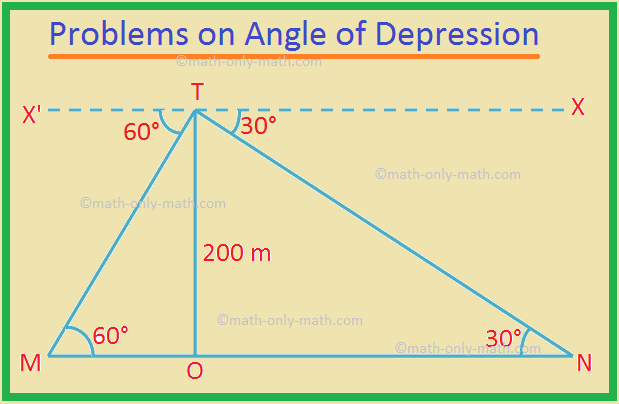
2. From the top of a cliff 200 m height, the angles of depression of two places A and B on the ground and on the opposite sides of the cliff are 60° and 30°. Find the distance between M and N.
Solution:
Let TO be the cliff, and given that TO = 200 m.
M and N are the two points.
The angle of depression ∠X'TM = 60° and ∠XTN = 30°.
By geometry, ∠TMO = 60° and ∠TNO = 30°.
In the right-angled ∆TOM,
tan 60° = \(\frac{TO}{MO}\)
⟹ √3 = \(\frac{200 m}{MO}\)
⟹ MO = \(\frac{200 m}{√3}\)
In the right-angled ∆TON,
tan 30° = \(\frac{TO}{NO}\)
⟹ \(\frac{40}{√3}\) = \(\frac{200 m}{NO}\)
⟹ NO = 200√3 m.
Therefore, the required distance MN = MO + NO
= \(\frac{200 m}{√3}\) + 200√3 m.
= \(\frac{200 + 600}{√3}\) m
= \(\frac{800}{√3}\) m
= \(\frac{800√3}{3}\) m
= \(\frac{800 × 1.732}{3}\) m
= 461.89 m (Approx.)
Word problems on Angle of Depression:
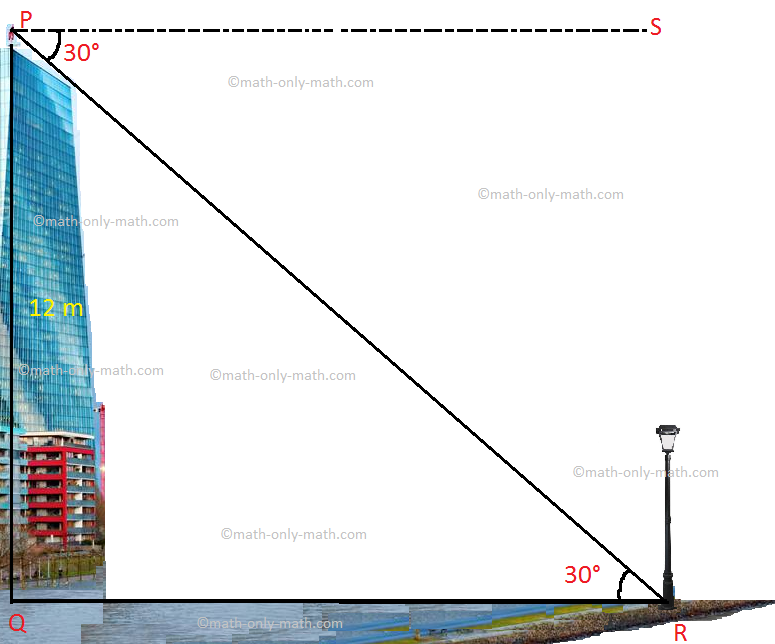
3. A building stands on the bank of a river. A man observes from a corner of the roof of the building, the foot of a electric post just on the opposite bank. If the angle of depression of the foot of the light post at your eye is 30° and the height of the building is 12 meters, what is the width of the river?
Solution:
Let P is the roof of the building, Q is the foot of the building vertically below the corner point and R is the foot of the light post just on the opposite of the bank of the river. A right-angled triangle PQR is formed by joining these points.
Let PS be the horizontal line through P.
∠SPR, the angle of depression = ∠PRQ = 30°, and with respect to this angle perpendicular PQ = 12 metres and base QR = width of the river = h metres.
From right-angled triangle PQR,
\(\frac{PQ}{QR}\) = tan 30°
\(\frac{12}{h}\) = \(\frac{1}{√3}\)
⟹ h = 12 × √3
⟹ h = 12 × 1.732
⟹ h = 20.784 (Approximately)
Therefore, the width of the river is 20.784 meters (Approximately).
Angle of Depression Problem:
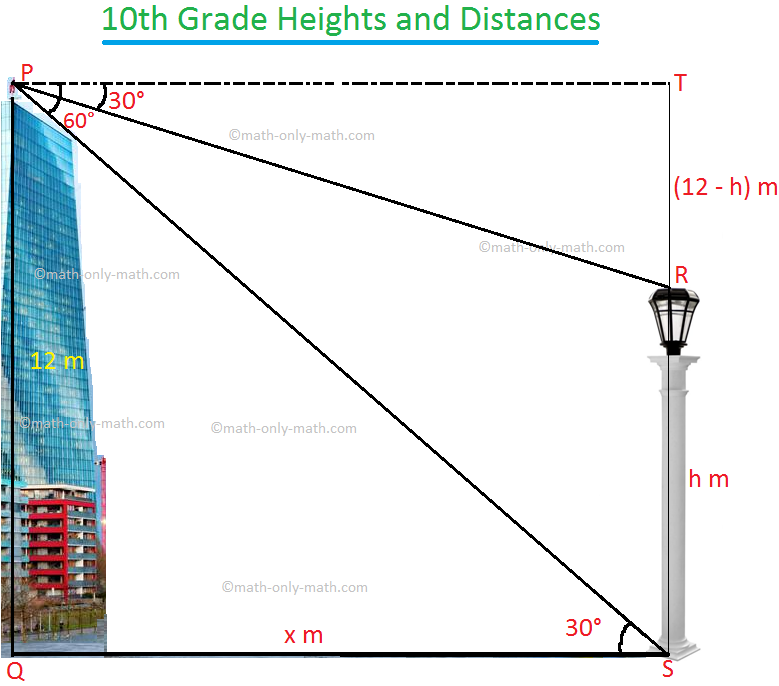
4. From the top of a building, the angle of depression of the top and the foof of a lamp post are 30° and 60° respectively. What is the height of the lamp post?
Solution:
According to the problem, the height of the building PQ = 12 m.
Let height of the lamp post RS.
Angle of depression of the top of a lamp post is 30°
Therefore, ∠TPR = 30°.
again, Angle of depression of the foot of a lamp post is 60°
Therefore, ∠TPS = 60°.
PQ = TS = 12 m.
Let the height of the lamp post RS = h m.
Therefore,
TR = (12 - h) m.
Also, let PT = x m
Now tan ∠TPR = \(\frac{TR}{PT}\) = tan 30°
Therefore, \(\frac{12 - h}{x}\) = \(\frac{1}{√3}\) ........... (i)
Again, tan ∠TPS = \(\frac{TS}{PT}\) = tan 60°
Therefore, \(\frac{12}{x}\) = √3 ........... (ii)
Dividing (i) by (ii), we get
\(\frac{12 - h}{12}\) = \(\frac{1}{3}\)
⟹ 36 - 3h = 12
⟹ 3h = 36- 12
⟹ 3h = 24
⟹ h = \(\frac{24}{3}\)
⟹ h = 8
Therefore, height of the lamp post is 8 metres.
From Angle of Depression to HOME
Didn't find what you were looking for? Or want to know more information about Math Only Math. Use this Google Search to find what you need.


New! Comments
Have your say about what you just read! Leave me a comment in the box below. Ask a Question or Answer a Question.