Subscribe to our ▶️ YouTube channel 🔴 for the latest videos, updates, and tips.
Home | About Us | Contact Us | Privacy | Math Blog
Worksheet on Third Grade Mixed Addition and Subtraction
Practice the questions given in the worksheet on third grade mixed addition and subtraction. These worksheets provide basic questions involving mixed operations to find their sum and difference.
1. Add the following:
(i) 768 + 536
(ii) 431 + 897
(iii) 095 + 950
(iv) 6325 + 1436
(v) 2636 + 6263
(vi) 8999 + 1111
2. Subtract the
following:
(i) 4639 - 2845
(ii) 9350 - 4249
(iii) 3649 - 1215
(iv) 987 - 678
(v) 392 - 218
(vi) 999 - 119
3. Simplify the following:
(i) 634 + 89 + 265
(ii) 1242 + 3210 + 1356
(iii) 572 - 172 + 372
(iv) 2310 + 3570 - 2310
(v) 835 + 61 - 321
(vi) 736 - 238 + 567
(vii) 3817 - 2130 + 515
(viii) 7667 + 2342 - 1359
(ix) 1552 - 167 - 132 + 86 + 9
(x) 2003 + 107 + 76 - 456 – 97
Simple mixed problems using addition and subtraction:
4. Find two addition facts for the following subtraction fact: 925 - 375 = 550
5. Find two subtraction facts for the following addition fact: 314 + 686 = 1000
6. Subtract the sum of 493 and 627 from 3725.
7. Subtract the difference of 5439 and 4391 from 3576.
8. How much more is the sum of 893 and 768 than their difference?
9. Find the greatest and smallest number with the digits 1, 2, 3 and 4. Find the sum and difference of these two numbers. No digit should be repeated in either of the numbers.
10. The difference between two numbers is 183. The smaller number is 4359. Find the greater number.
11. Add 2725 and 1368 and subtract 2895 from the sum.
12. Fill in the blanks:

13. This is a magic square having 3 columns and 3 rows. If we add the numbers vertically, horizontally or diagonally, we get the same total. In this square we have used the numbers 1 to 9 and the same total we get, is 15.
Similarly make the following magic squares.

Numbers 5 to 13
Sum = 27

Numbers 10 to 18
Sum = 42

Numbers 12 to 20
Sum = 48
14. Write the numbers 10, 20, 30, 40, 50 and 60 in the circles in such a way that by adding the numbers on each side, the sum becomes 90.

Answers for the worksheet on third grade mixed addition and subtraction are given below to check the exact answers of above mixed problems involving the operations of addition and subtraction.
Answers:
1. (i) 1304
(ii) 1328
(iii) 1045
(iv) 7761
(v) 8899
(vi) 10110
2. (i) 1794
(ii) 5101
(iii) 2434
(iv) 309
(v) 174
(vi) 880
3. (i) 988
(ii) 5808
(iii) 772
(iv) 3570
(v) 575
(vi) 1065
(vii) 2202
(viii) 8650
(ix) 1348
(x) 1633
4. (i) 375 + 550 = 925
(ii) 550 + 375= 925
5. (i) 1000 - 686 = 314
(ii) 1000 - 314 = 686
6. 2605
7. 2528
8. 1536
9. Greatest number: 4321; Smallest number: 1234; Sum: 5555; Difference: 3087
10. greater number = 4542
11. sum= 4093; difference = 1198
12. (i) 4534 + 2342 = 6876
(ii) 7442 - 3120 = 4322
13.

14.

From Worksheet on Third Grade Mixed Addition and Subtraction to HOME PAGE
Didn't find what you were looking for? Or want to know more information about Math Only Math. Use this Google Search to find what you need.

Recent Articles
-
5th Grade Pie Chart | Definition of Pie Chart | Construction |Examples
Jul 31, 25 05:12 PM
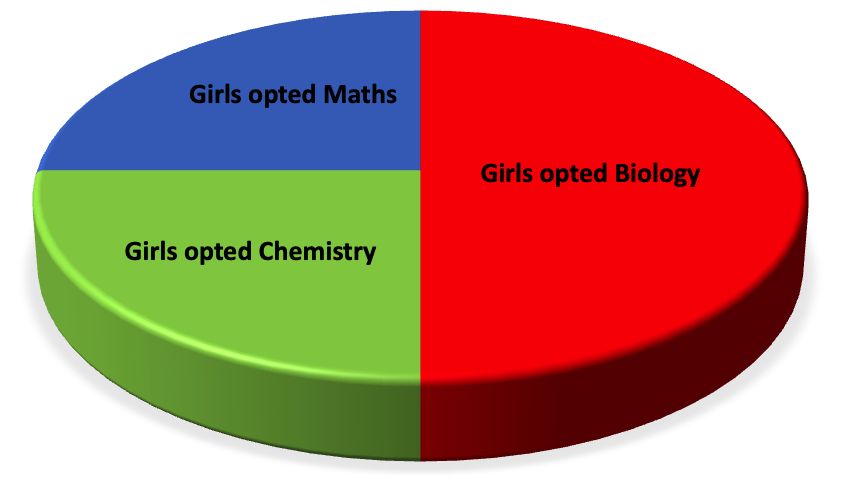 Data can also be represented in a circle. This method, to represent data, is called a pie chart. Let us understand this method with the help of an example.
 -
Frequency Distribution |Tally Marks |Frequency Distribution Table
Jul 31, 25 12:23 PM
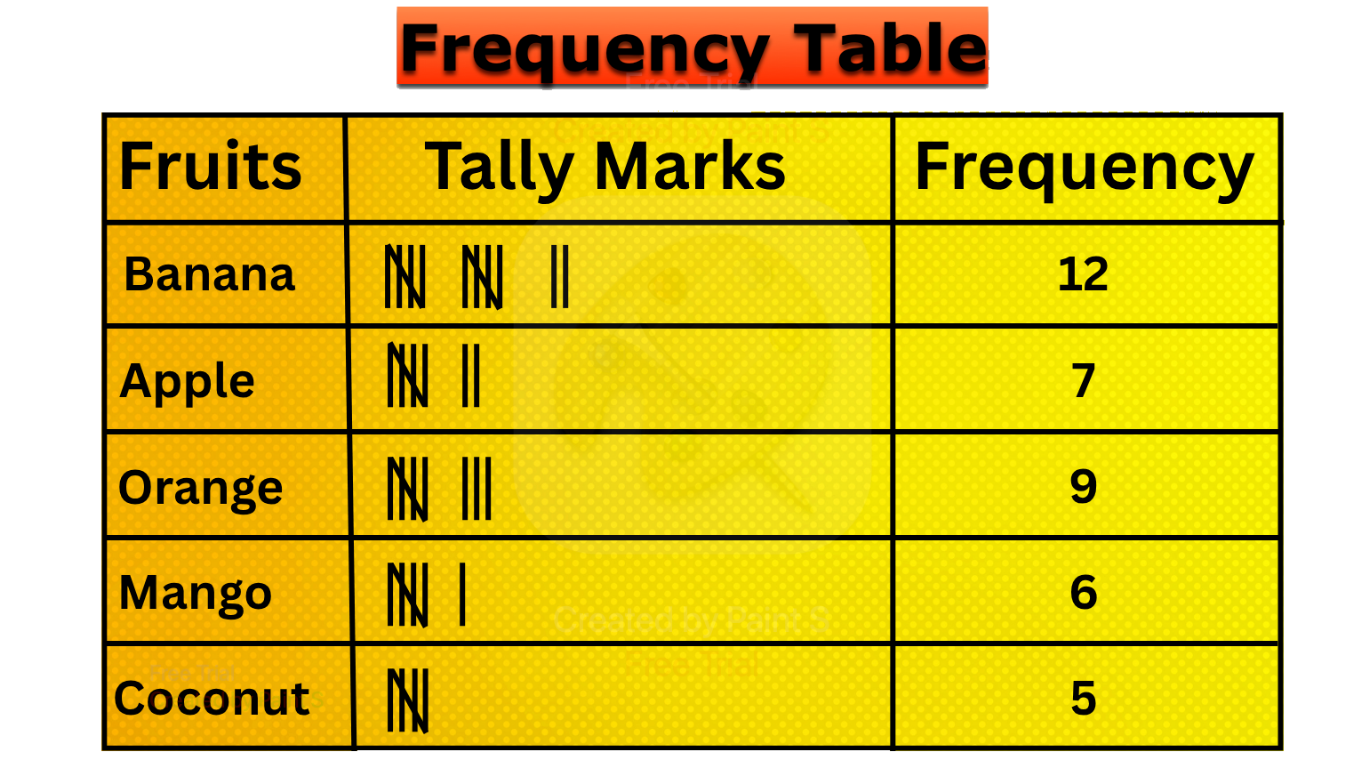 What is frequency distribution?The number of times a particular observation occurs in a given data is called its frequency. In 7ᵗʰ grade and 8ᵗʰ grade frequency distribution,
 -
5th Grade Bar Graph | Definition | Interpret Bar Graphs|Free Worksheet
Jul 31, 25 05:16 AM
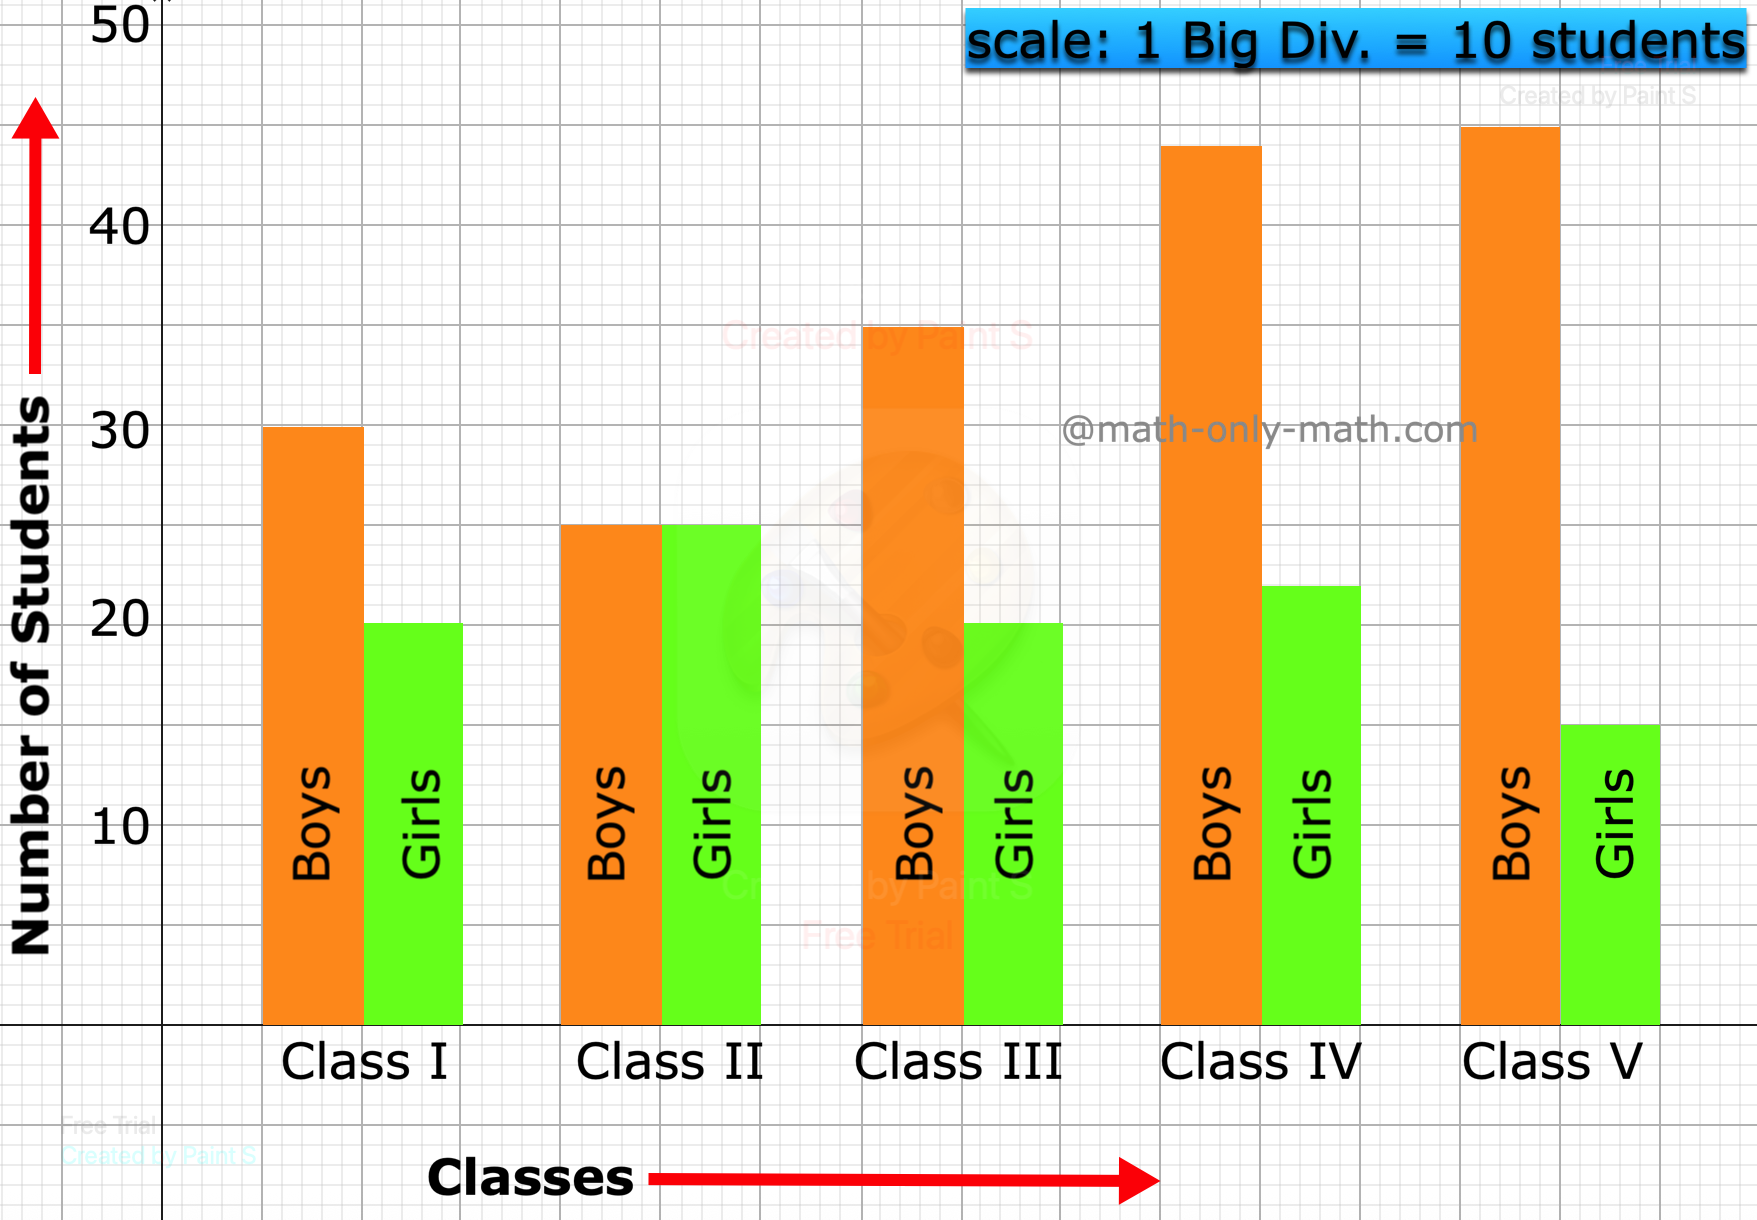 We learn how to represent the data on the bar graph. Data can be represented by bars (like rectangle) whose lengths represent numerical values. One can use horizontal or vertical bars. Instead of rect…
 -
Construction of Bar Graphs | Examples on Construction of Column Graph
Jul 31, 25 03:35 AM
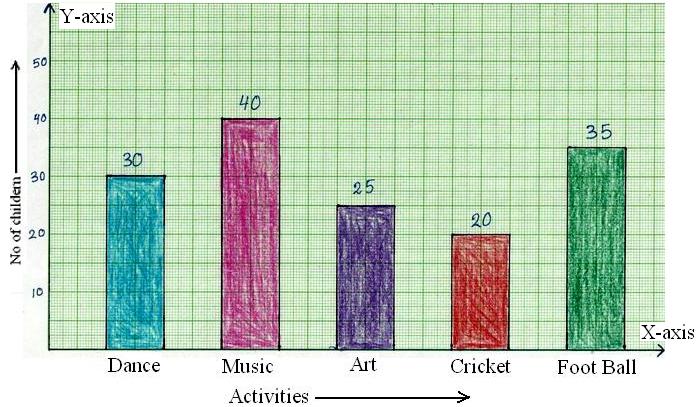 Now we will discuss about the construction of bar graphs or column graph. In brief let us recall about, what is bar graph? Bar graph is the simplest way to represent a data. In consists of rectangular…
 -
Successor and Predecessor | Successor of a Whole Number | Predecessor
Jul 29, 25 12:59 AM
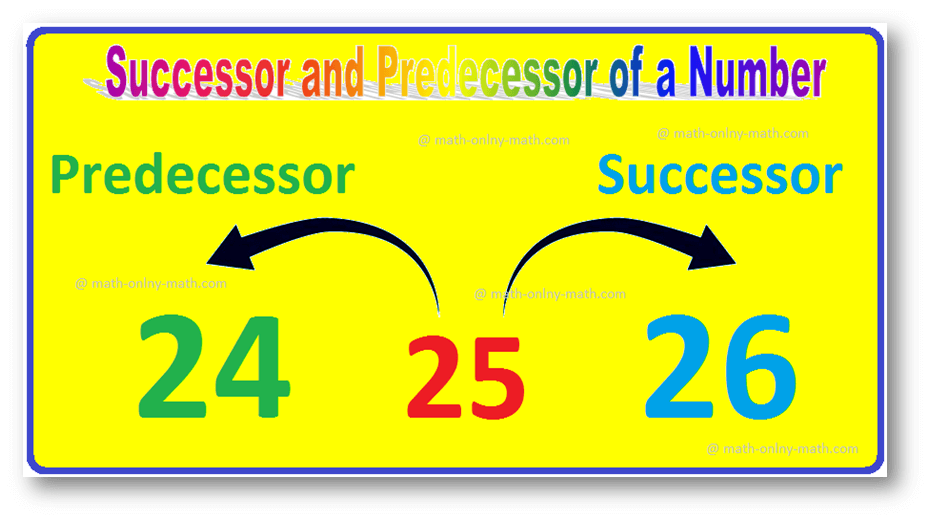 The number that comes just before a number is called the predecessor. So, the predecessor of a given number is 1 less than the given number. Successor of a given number is 1 more than the given number…
New! Comments
Have your say about what you just read! Leave me a comment in the box below. Ask a Question or Answer a Question.