Subscribe to our ▶️YouTube channel🔴 for the latest videos, updates, and tips.
Home | About Us | Contact Us | Privacy | Math Blog
Graph of y = sin x
y = sin x is periodic function. The period of y = sin x is 2π. Therefore, we will draw the graph of y = sin x in the interval [-π, 2π].
For this, we need to take the different values of x at intervals of 10°. Then by using the table of natural sines we will get the corresponding values of sin x. Take the values of sin x correct to two place of decimal. The values of sin x for the different values of x in the interval [-π, 2π] are given in the following table.
We draw two mutually perpendicular straight lines XOX’ and YOY’. XOX’ is called the x-axis which is a horizontal line. YOY’ is called the y-axis which is a vertical line. Point O is called the origin.
Now represent angle (x) along x-axis and y (or sin x) along y-axis.
Along the x-axis: Take 1 small square = 10°.
Along the y-axis: Take 10 small squares = 1 unity.
Now plot the above tabulated values of x and y on the co-ordinate graph paper. Then join the points by free hand. The continuous curve obtained by free hand joining is the required graph of y = sin x.
Steps to draw the graph of y = c
sin ax.
Steps I: Obtain the values of a and c.
Step II: Draw the graph of y = sin x and mark the points where y = sin x crosses x-axis.
Step III: Divide the x-coordinate of the points where y = sin x crosses x-axis by a and mark maximum and minimum values of y = c sin ax as c and –c on y-axis.
The graph obtained is the required graph of y = c sin ax.
Properties of y = sin x:
(i) The graph of the function y = sin x is continuous and extends on either side in symmetrical wave form.
(ii) Since the graph intersects the x-axis at the origin and at points where x is an even multiple of 90°, hence sin x is zero at x = nπ where n = 0, ±1, ±2, ±3, ±4, ……………... .
(iii) The ordinate of any point on the graph always lies between 1 and - 1 i.e., - 1 ≤ y ≤ 1 or ,-1 ≤ sin x ≤ 1 hence, the maximum value of sin x is 1 and its minimum value is - 1 and these values occur alternately at π2, 3π2, 5π2,……… i. e., at x = (2n + 1)π2, where n = 0, ±1, ±2, ±3, ±4, ……………...
(iv) Since the function y= sin x is periodic of period 2π, hence the portion of the graph between 0 to 2π is repeated over and over again on either side.
Solved example to sketch the graph of y = sin x:
Sketch the graph of y = 2 sin 3x.
Solution:
To obtain the graph of y = 2 sin 3x we first draw the graph y = sin x in the interval [0, 2n] and then divide the x-coordinates of the points where it crosses x-axis by 3. The maximum and minimum values are 2 and -2 respectively.
● Graphs of Trigonometrical Functions
- Graph of y = sin x
- Graph of y = cos x
- Graph of y = tan x
- Graph of y = csc x
- Graph of y = sec x
- Graph of y = cot x
From Graph of y = sin x to HOME PAGE
Didn't find what you were looking for? Or want to know more information about Math Only Math. Use this Google Search to find what you need.

Recent Articles
-
Formation of Numbers | Smallest and Greatest Number| Number Formation
Jul 15, 25 11:46 AM
In formation of numbers we will learn the numbers having different numbers of digits. We know that: (i) Greatest number of one digit = 9, -
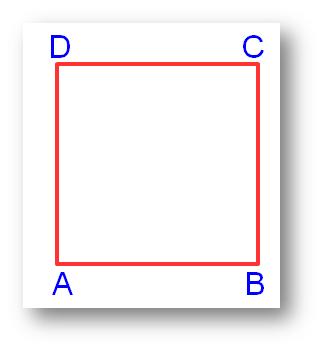
Formation of Square and Rectangle | Construction of Square & Rectangle
Jul 15, 25 02:46 AM
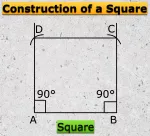 In formation of square and rectangle we will learn how to construct square and rectangle. Construction of a Square: We follow the method given below. Step I: We draw a line segment AB of the required…
 -
5th Grade Quadrilaterals | Square | Rectangle | Parallelogram |Rhombus
Jul 15, 25 02:01 AM
 Quadrilaterals are known as four sided polygon.What is a quadrilateral? A closed figure made of our line segments is called a quadrilateral. For example:
 -
5th Grade Geometry Practice Test | Angle | Triangle | Circle |Free Ans
Jul 14, 25 01:53 AM
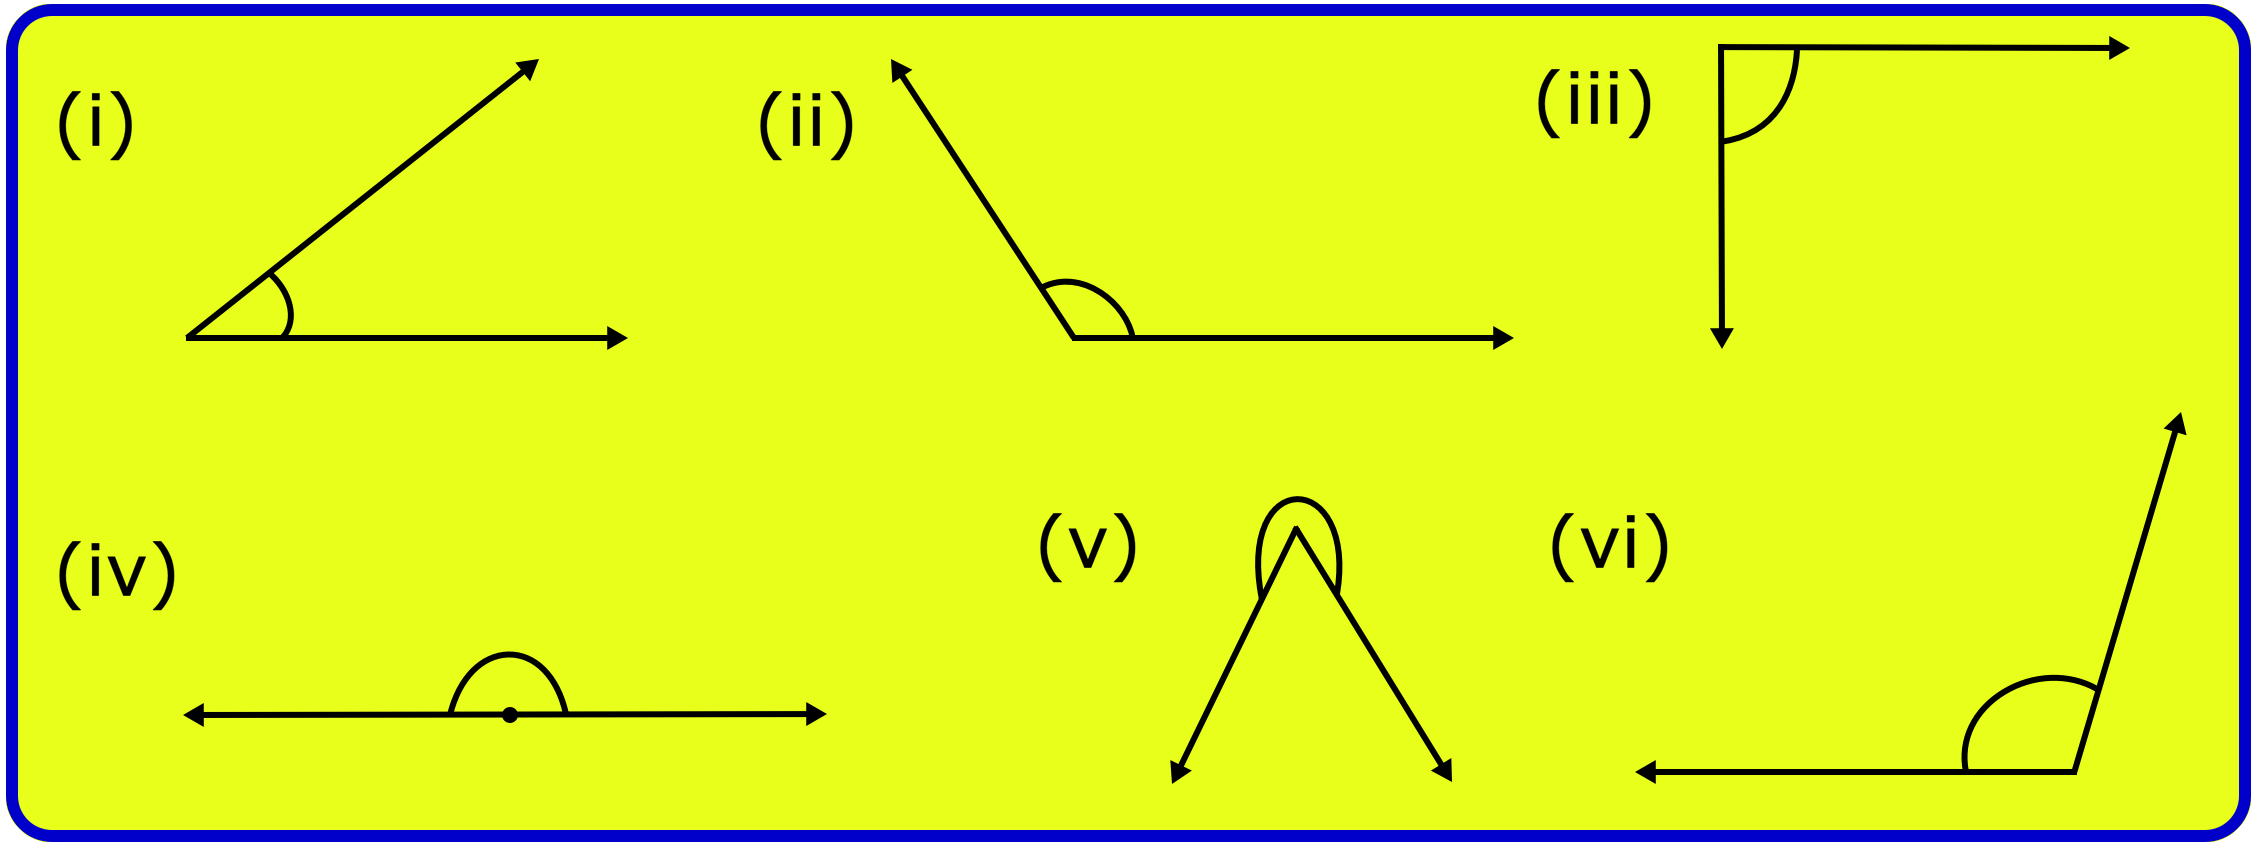 In 5th grade geometry practice test you will get different types of practice questions on lines, types of angle, triangles, properties of triangles, classification of triangles, construction of triang…
 -
5th Grade Circle Worksheet | Free Worksheet with Answer |Practice Math
Jul 11, 25 02:14 PM
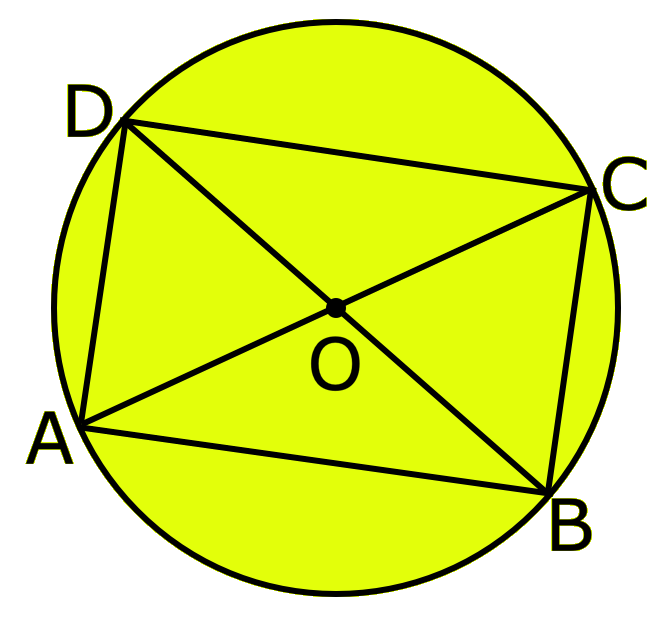 In 5th Grade Circle Worksheet you will get different types of questions on parts of a circle, relation between radius and diameter, interior of a circle, exterior of a circle and construction of circl…
New! Comments
Have your say about what you just read! Leave me a comment in the box below. Ask a Question or Answer a Question.