Subscribe to our ▶️ YouTube channel 🔴 for the latest videos, updates, and tips.
Worksheet on Finding the Mean of Classified Data
In worksheet on finding the mean of classified data we will solve various types of practice questions on measures of central tendency. Here you will get 9 different types of questions on finding the mean of classified data.
1. The following table gives marks scored by students in an examination.
Marks
0 - 5
5 - 10
10 - 15
15 - 20
20 - 25
25 - 30
30 - 35
35 - 40
Number of Students
3
7
15
24
16
8
5
2
(i) Calculate the mean mark, correct to two decimal places.
(ii) Calculate the mean mark by taking the assumed mean a = 17.5
2. The following table gives the wages of workers in a factory:
Marks
45 - 50
50 - 55
55 - 60
60 - 65
65 -70
70 - 75
75 - 80
Number of Students
5
8
30
25
14
12
6
Calculate the mean by short-cut method.
3. The following table gives the weekly wages of workers in a factory.
Weekly wages (in Dollar)
50 - 55
55 - 60
60 - 65
65 - 70
70 - 75
75 - 80
80 - 85
85 - 90
Number of Workers
5
20
10
10
9
6
12
8
Calculate
(i) the mean
(ii) the number of workers getting weekly wages below $ 80
(iii) the number of workers getting $ 65 or more but less than $ 85 as weekly wages.
4. The weights of 50 apples were recorded as given below. Calculate the mean weight, to the nearest gram, by the step-deviation method.
Weight (in g)
80 - 85
85 - 90
90 - 95
95 - 100
100 -105
105 - 110
110 - 115
Number of Apples
5
8
10
12
8
4
3
5. Find the unknown frequencies in the following distribution if its mean is known to be 10.8.
Class Interval
0 - 4
4 - 8
8 - 12
12 - 16
16 - 20
Total
Frequency
3
...
...
8
2
20
6. Weights of 50 eggs were recorded as below.
Weight (in g)
80 - 84
85 - 89
90 - 94
95 - 99
100 -104
105 - 109
110 - 114
Number of Eggs
5
10
12
12
8
2
1
(i) Calculate the mean weight of eggs to the nearest gram.
(ii) Calculate the mean weight of eggs by the step-deviation method.
7. Taking the assumed mean a = 18, find the mean of the following distribution.
Class Interval
1 - 5
6 - 10
11 - 15
16 - 20
21 - 25
26 - 30
31 - 35
Frequency
4
12
7
10
5
6
2
8. Find the mean age from the following distribution.
Age (in Years)
Under 10
Under 20
Under 30
Under 40
Under 50
Under 60
Number of Males
6
10
25
32
43
50
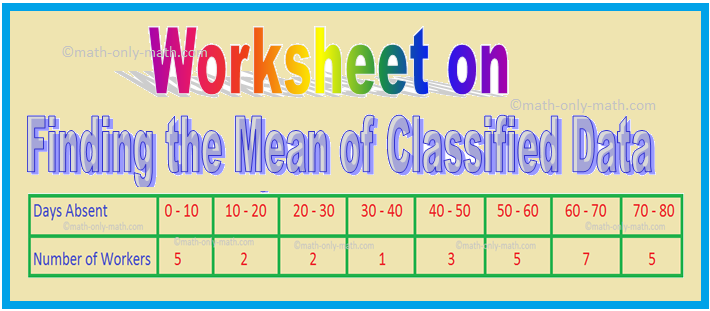
9. The number of days 30 workers of a factory were absent in s year was found to be as below.
2, 14, 50, 72, 9, 48, 61, 60, 75, 39, 4, 8, 26, 62, 70, 58, 29, 77, 64, 43, 56, 67, 45, 58, 69, 76, 6, 50, 17, 66
Prepare the frequency table with overlapping intervals of size 10, and calculate the mean of the number of days the workers were absent.
Answers on Worksheet on Finding the Mean of Classified Data are given below to check the exact answers of the questions.
Answers
1. (i) 18.56
(ii) 18.56
2. 62.25
3. (i) $ 69
(ii) 60
(iii) 37
4. 95.9 g
5. 2 and 5 respectively.
6. (i) 94 g
(ii) 94 g
7. 15.83
8. 31.8 years
9.
46 days
From Worksheet on Finding the Mean of Classified Data to HOME PAGE
Didn't find what you were looking for? Or want to know more information about Math Only Math. Use this Google Search to find what you need.


New! Comments
Have your say about what you just read! Leave me a comment in the box below. Ask a Question or Answer a Question.