Tally Marks
We will discuss here how to use Tally marks.
We know that data is a collection of information. When the data is large, it may not be easy to count. So, we make use of tally marks. Tally marks is the quick way of recording the given data by grouping in bunches of five. The first four tallies are marked vertically and the 5th tally in a bunch is marked diagonally across the four tallies.
To count the number of times a value of the variable appears in a collection of data, we use tally mark ( / ). Thus tally mark represents frequency.
The first four tallies are marked vertically and the 5th tally in a bunch is marked diagonally across the previous 4 as shown below:

After 5th mark the counting continues by making single marks again as shown-

Observe the tally marks and the corresponding frequencies:

Example:
(i) Write the tally marks for a frequency of 22.
(ii) What is the frequency corresponding to the tally marks
Solution:
(i)
(ii) 16 (Since, 5 + 5 + 5 + 1 = 16)
Interpretation of Tally Marks:
The tally chart shows the items sold during the weekends. Use the information from the tally chart to answer the questions.

Observe the above table and answer the following questions:
1. Which item was sold maximum and how many were sold?
Ice-cream was sold maximum.
5 + 5 + 5 + 5 + 4 = 24
2. How many French Fries were sold over the weekend?
5 + 5 + 4 = 14
3. Which item was the least selling item?
Patties
4. How many more Burgers were sold than Fried Rice?
Burgers = 18 and Fried Rice = 11
18 – 11 = 7. So, 7 Burgers were sold more than the Fried Rice.
5. How many items were sold in all?
|
Burger Cake Patties Ice-cream French Fries Fried Rice Total |
18 19 10 24 14 11 = 96 items |
Problems on Tally Marks:
1. The weights (in kg) of the teachers of s school are recorded as shown below.
60, 65, 63, 70, 65, 62, 65, 63, 64, 60, 68, 58, 62, 65, 63, 65, 64, 60, 62, 63.
If the collection of data be grouped into the class intervals 56 - 59, 59 - 62, 62 - 65, 65 - 68, 68 -71 then write the tally marks for the frequency of variate 65 and the class interval 62 - 65.
Answer:
(Since only 62, 62, 62, 63, 63, 63, 63, 64, 64 fall in this class)
2. The weights (in kg) of the teachers of s school are recorded as shown below.
60, 65, 63, 70, 65, 62, 65, 63, 64, 60, 68, 58, 62, 65, 63, 65, 64, 60, 62, 63.
If the collection of data be grouped into the class intervals 56 - 59, 60 - 63, 64 - 67, 68 - 71 then write the tally marks for the frequency of the class 60 - 63.
Answer:
(Since only 60, 60, 60, 62, 62, 62, 63, 63, 63, 63 fall into this class)
Questions and Answers on Tally Marks:
When the observations are large, it may not be easy to interpret the data by simply counting, so we make the use of bass (|, \) called the tally marks.
Tally marks is the quick and easiest way of counting objects from the given data by grouping in bunches of five.
One vertical line (|) is made for each of the first four numbers and a diagonal line (\) across the previous four marks to represent the fifth number.
1. Write the numbers for the given tally marks.

Answer:
1. (i) 4
(ii) 6
(iii) 8
(iv) 13
(v) 7
(vi) 18
(vii) 9
(viii) 11
(ix) 5
(x) 15
2. The tally chart below shows different colors of cars that passed the school gate in five minutes. How many blue cars did pass?

Answer:
2. 12
3. 20 students gave their choice of favourite soft drink flavour as follows. Represent the given information using tally marks.
|
Orange, Cola, Lemon, Lemon, Cola, Cola, Mango, Mango, Cola, Orange, Orange, Orange, Mango, Cola, Cola, Cola, Cola, Orange, Lemon, Orange. |

Answer:
3. Number of Orange Flavour: 6
Number of Cola Flavour: 8
Number of Lemon Flavour: 3
Number of Mango Flavour: 3

4. Aaron tossed a dice 30 times, with the following results:
2, 3, 1, 6, 4, 5, 6, 3, 3, 5, 2, 3, 6, 4, 1, 5, 4, 1, 1, 6, 4, 3, 2, 2, 5,1, 3, 4, 6, 6
How many fives did he get?
Answer:
4
5. Fill in the blank:
In tally chart vertical lines are drawn for first ............. numbers.
Answer:
4
6. Observe the given chart. It shows the different types of shapes used by the students to decorate the class board. Represent the data using a tally chart.
 |
 |
Answer:

7. 40 children of grade III voted for the monitor of class. On counting the votes the following results were obtained. Put tally mark for each vote in the given table.
Amy, David, Amelia, Sam, Gary, Gary, David, Amy, Amelia, Amelia, Sam, David, Sam, Gary, Amy, Amelia, Amelia, Gary, Amy, Sam, David, Amelia, Amy, Amy, Sam, Sam, Gary, David, Amelia, Amy, David, David, David, Gary, Amelia, Amelia, Amy, Sam, Sam, Amelia
Fill in the table:


Answer the following questions:
(i) Who was elected as a monitor?
(ii) How many votes did the monitor get?
(iii) Who got the least number of votes?
(iv) Who all got the same number of votes?
Answers:
(i) Amelia
(ii) 10
(iii) Gary
(iv) David, Sam and Amy
8. The marks scored (out of 20) by Ron in a unit test are as follows.

Answer the following questions.
(i) In which subject did he score maximum marks?
(ii) In which subject did he score minimum marks?
(iii) In how many subjects did he score less than 15 marks?
(iii) In how many subjects did he score full marks?
Answer:
8. (i) Science
(ii) Hindi
(iii) Two
(iii) Science
9. The number of members in 30 families of a society is as follows.
2, 3, 6, 5, 6, 4, 4, 4, 8, 4, 3, 3, 2, 4, 6, 4, 5, 3, 2, 5, 6, 4, 8, 5, 4, 3, 2, 4, 5, 3.
Represent the given data using tally marks.
|
Families |
Tally Marks | |
|
(i) |
Family of 2 members |
_____________ |
|
(ii) |
Family of 3 members |
_____________ |
|
(iii) |
Family of 4 members |
_____________ |
|
(iv) |
Family of 5 members |
_____________ |
|
(v) |
Family of 6 members |
_____________ |
|
(vi) |
Family of 8 members |
_____________ |
Answer:

10. The following pictograph shows the number of trees planted in a week by Sarah.
 |
= 1 tree |
Number of Trees Planted in a Week

Answer the following questions:
(i) On which days, equal number of trees were planted?
(ii) On which day did Sarah plant maximum number of trees?
(iii) On which day did Sarah plant 4 trees?
(iv) Find the total number of trees planted in a week.
(v) Express the total number of trees planted on each day using tally marks in the given column.
Answer:
(i) Friday and Sunday
(ii) Saturday
(iii) Thursday
(iv) 24
(v)

11. Nairitee and her friend bought some sandwiches, cupcakes and candies.

Draw tally marks to show the number of items in each kind and answer the questions.

(i) Which item is least in numbers?
(ii) How many more candies did they buy than cupcakes?
(iii) Which item counts more than 8?
(iv) How many items are there in all?
Answer:

(i) Sandwich
(ii) 3
(iii) Candies
(iv) 19
12. Given below is the average sleeping hours in a day of some animals. Observe the given table and fill in the blanks.

Now, observe the table and answer the following questions.
(i) Which animal sleeps maximum number of hours?
(ii) Name the animals which sleeps less than 12 hours in a day.
(iii) Which animals sleeps minimum number of hours?
(iv) If the given data is represented pictorially, write the title and key for the same.
Answer:

(i) Lion
(ii) Cat, Goat and Horse
(iii) Horse
(iv) Animals Sleeping Hours in a Day
The above examples will help us to understand tally marks.
Didn't find what you were looking for? Or want to know more information about Math Only Math. Use this Google Search to find what you need.


Recent Articles
-
Conversion of Measuring Length | Conversion of Length | Length Convers
May 01, 24 02:57 PM
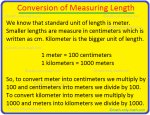 In conversion of measuring length we will learn how to convert meters into centimeters, kilometers into meters, centimeters into meters and meters into kilometers. To convert meters into centimeters…
 -
Conversion of Standard Unit of Capacity | Unit of Capacity | Problems
May 01, 24 02:55 PM
For the conversion of standard unit of capacity it’s very important to know the relationship between the different units of capacity. We know, one litre = 1000 millilitre 1000 millilitre = 1 litre -
Conversion of Measuring Mass | Conversion of Kilograms into Grams | kg
May 01, 24 02:45 PM
In conversion of measuring mass we will learn how to convert kilograms into grams, grams into kilograms, kilograms & grams into grams and grams into kilograms & grams. Conversion of kilograms -
Unit of Mass or Weight | Unit Weights for Measuring | Common Balance
Apr 30, 24 05:38 PM
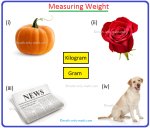 We know the main standard unit of mass or weight is kilogram which we write in short as ‘kg’. 1000th part of this kilogram is gram which is written in short as ‘g’.
 -
Units for Measuring Length | Standard Units of Length |Kilometre Metre
Apr 30, 24 04:47 PM
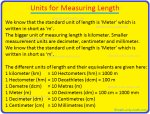 Units for measuring length are discussed here. We know that the standard unit of length is ‘Metre’ which is written in short as ‘m’. A metre length is divided into 100 equal parts. Each part is named
New! Comments
Have your say about what you just read! Leave me a comment in the box below. Ask a Question or Answer a Question.